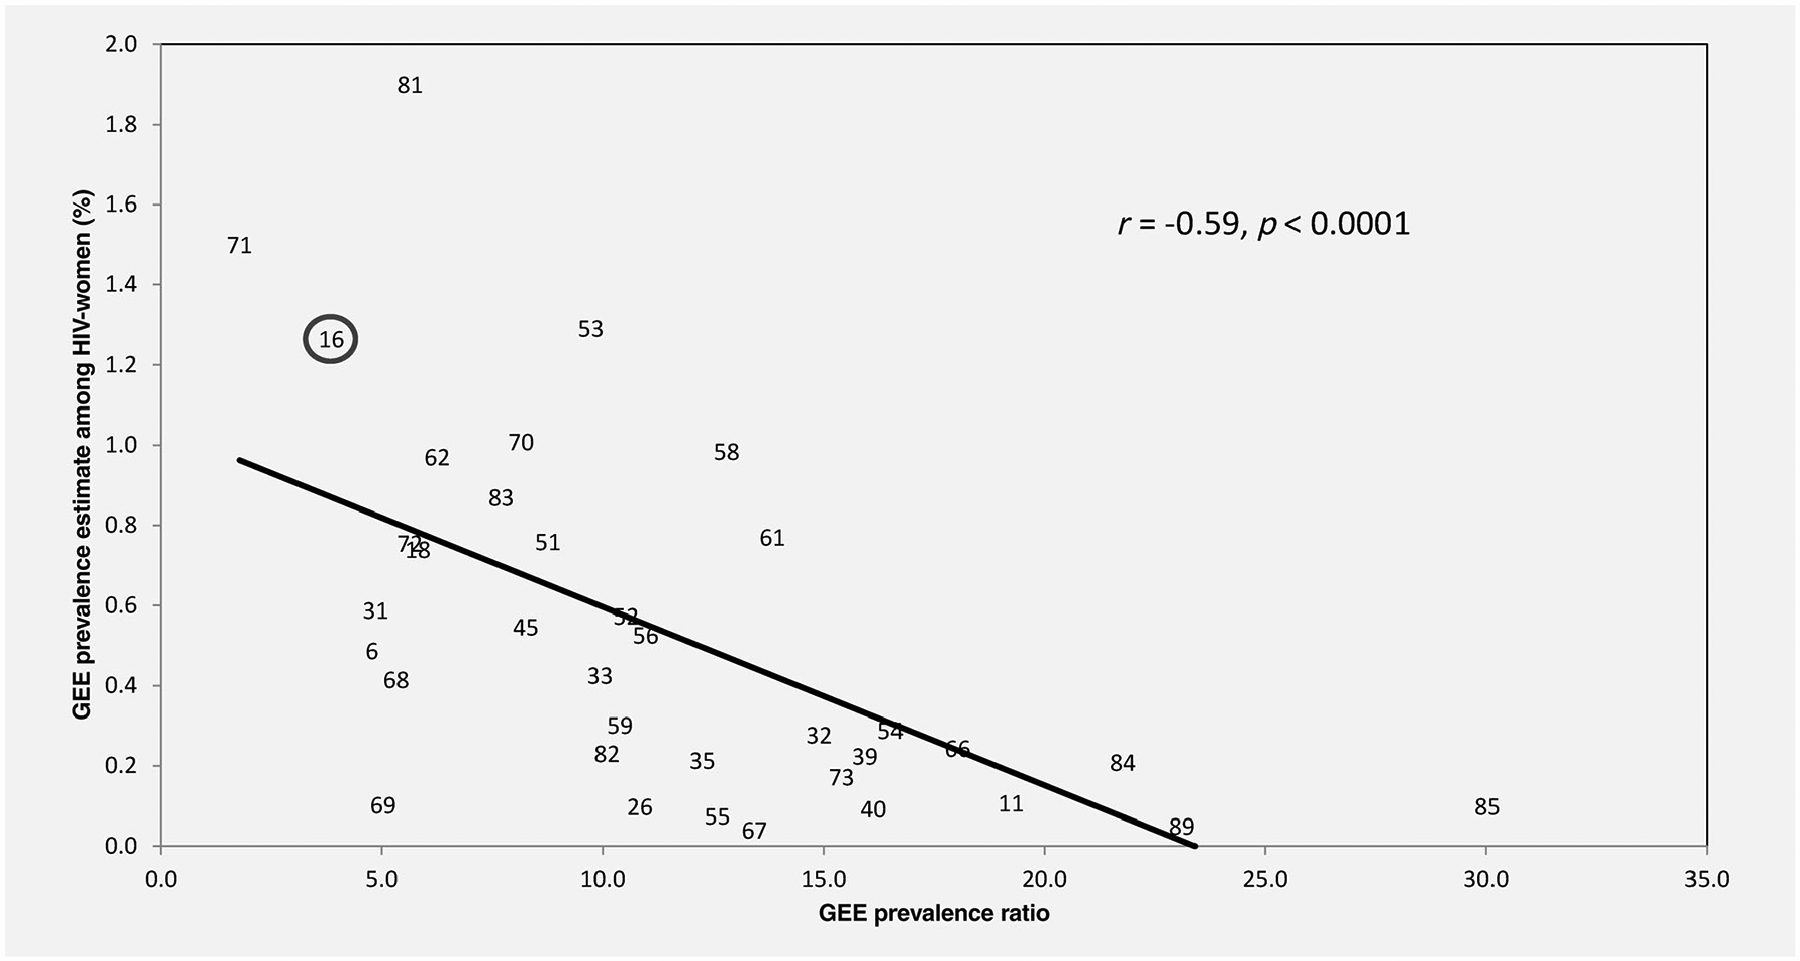
Figure 1.

Scatter plot and linear association between [X-axis] HPV type-specific GEE summary prevalence ratios (PRs) of HIV[+] and CD4 <200 related to HIV[−] women and the [Y-axis] average GEE prevalence of each individual HPV type across all study visits in HIV[−] women. The linear correlation (indicated by the line) and the Spearman correlation (r) are both shown. Each number in the figure specifies the HPV type related to that data point on the graph. HPV16 is circled as a reference.
