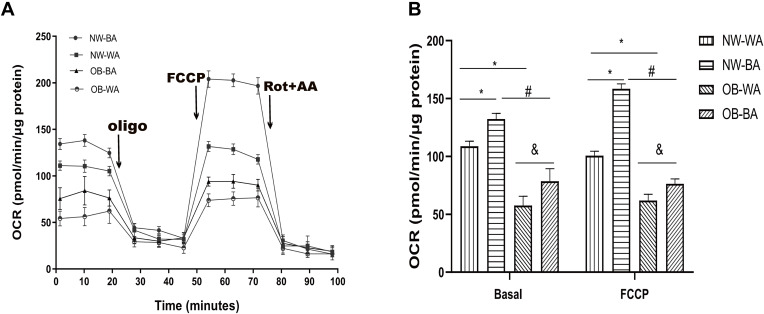
Figure 6.
Mitochondria oxygen consumption rate in differentiated adipocytes. The differentiated adipocytes derived from the normal-weight (NW) and obese (OB) groups treated with white adipocyte (WA)- and beige adipocytes (BA)-induction were used to detect oxygen consumption rate (OCR). Basal OCR were measured before sequential addition of reagents, FCCP was added to render maximum OCR (A). Basal and maximum OCR were normalized by the total-cell protein concentration (B). Values are mean ± SD; n = 12 for the NW-WA, NW-BA, OB-WA and OB-BA groups; data used for analysis are mean values of four replicate wells for each sample. *p< 0.01 vs NW-WA group, #p< 0.01 vs NW-BA group, &p< 0.01 vs OB-WA group.

