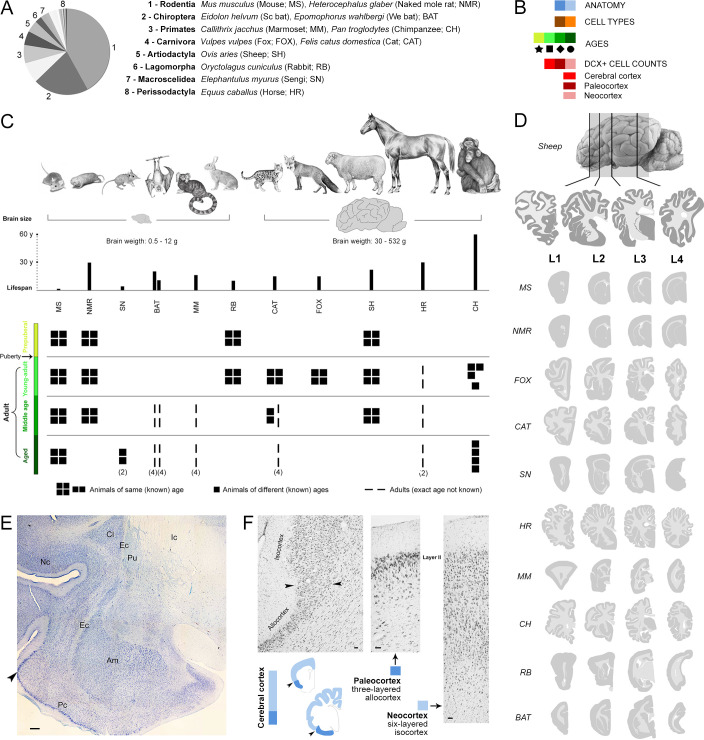
Figure 1. Sample of species, ages, and comparable brain regions (coronal levels) of the mammals used in this study (Supplementary file 1).
(A, C) Mammalian species and orders (scientific name, common name – used hereafter – and abbreviation) with special reference to their brain size and lifespan (C, top). (B) Color code (see also Figure 4). (C, bottom), Different ages considered for each species; all groups are composed of four individuals (apart from different specification; Supplementary file 1). (D) Four anterior-posterior brain levels, identified by comparable neuroanatomy based on histology (example of a cat brain section in E), and correspondent mini-atlases for each animal species; representative sections within the thickness of each level are shown. (F) Paleocortex-neocortex transition (arrowheads), identified histologically as a shift from three to six cortical layers. Scale bars: E, 500 µm; F, 50 µm.


