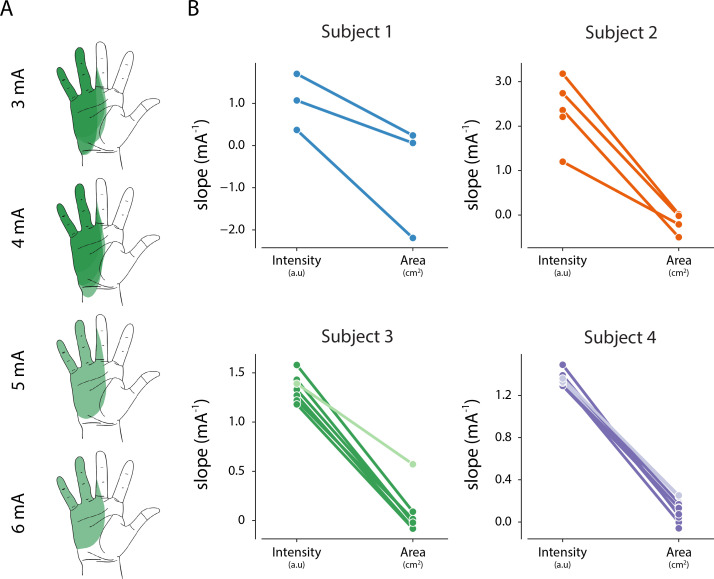
Figure 5. Relationship between intensity and area of evoked percept, and stimulation amplitude.
(A) Example of the stability of percept area with increasing amplitude for one electrode in Subject 3. (B) Summary of the relationship between stimulation amplitude and percept characteristics for each electrode that evoked a percept in the phantom hand. The slope of the linear fit between stimulation amplitude and reported intensity was obtained from magnitude estimation trials. The slope of the linear fit between stimulation amplitude and percept area was obtained from percept mapping trials. Lighter shades represent electrodes where parea < 0.01. The null hypothesis is that the slope of the linear fit is zero. Source data for panel B are available in Figure 5—source data 1.

