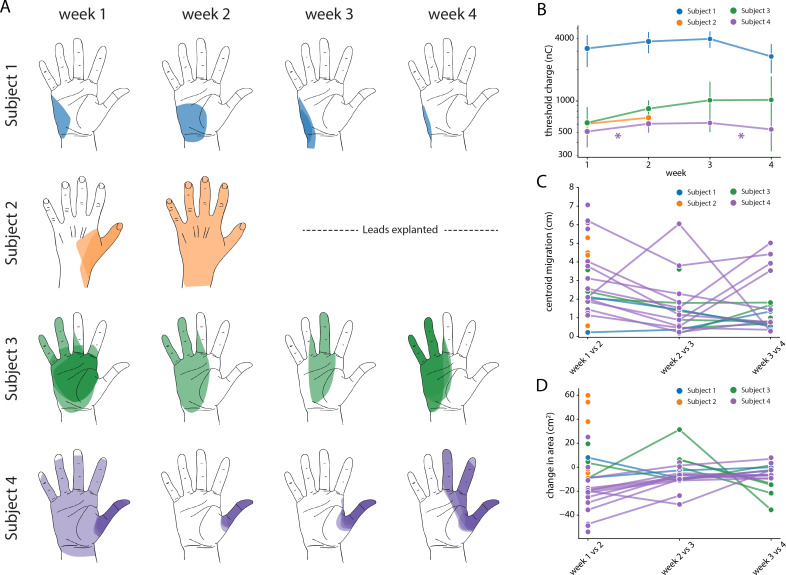
Figure 7. Stability of the sensory percepts.
(A) Example sensory percepts from the hand for a single electrode in Subjects 1–4. For Subject 2, the percepts are shown for weeks 1 and 2 only, as the leads were explanted after that. The percepts shown were evoked by the minimum stimulus amplitude that was tested at least once per week for the maximal number of weeks. Each column shows the location of all percepts evoked for that week of testing. Multiple examples of the percepts evoked during the week are superimposed on each other as indicated by different shades. (B) Time course of the average stimulation threshold (in nC) for evoking a percept in the phantom hand for each subject. Weeks with a significant change in threshold are annotated with an asterisk. (C) Stability of the location of the evoked percept in the phantom hand. For each electrode, the centroid location of the evoked percept was compared between successive weeks. (D) Stability of the area of the evoked percept in the phantom hand. For each electrode, the area of the evoked percept was compared between successive weeks. Source data for panels B-D are available in Figure 7—source data 1, Figure 7—source data 2, and Figure 7—source data 3, respectively.

