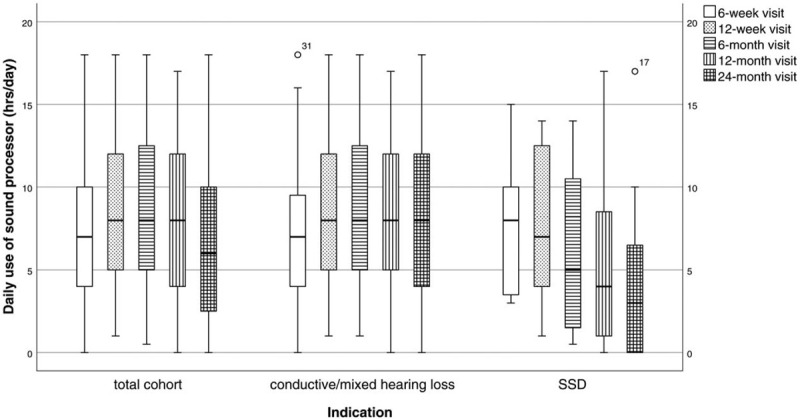
FIG. 2.

Daily use of sound processor per visit for the total cohort as well as per indication. The median (horizontal bar) is defined within each plot, boxes represent interquartile range, whiskers represent 95% range and dots represent outlier values.
