FIGURE 1.

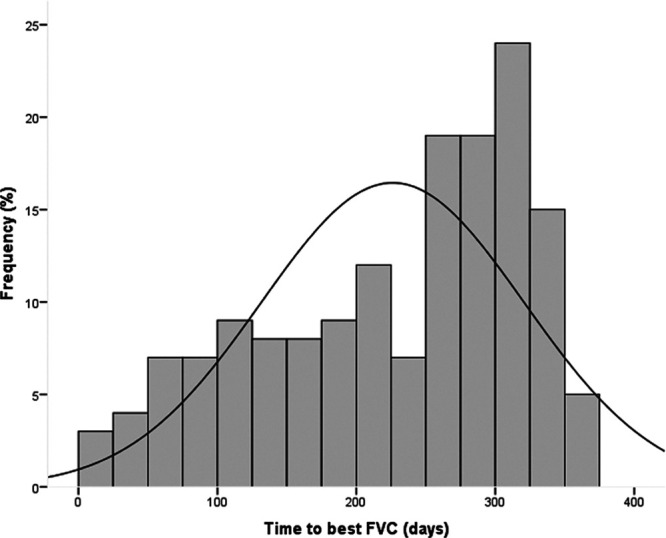
Histogram showing the frequency distribution of patients based upon the time since transplant to achieve the best FVC for the complete study group. FVC, forced vital capacity.

Histogram showing the frequency distribution of patients based upon the time since transplant to achieve the best FVC for the complete study group. FVC, forced vital capacity.