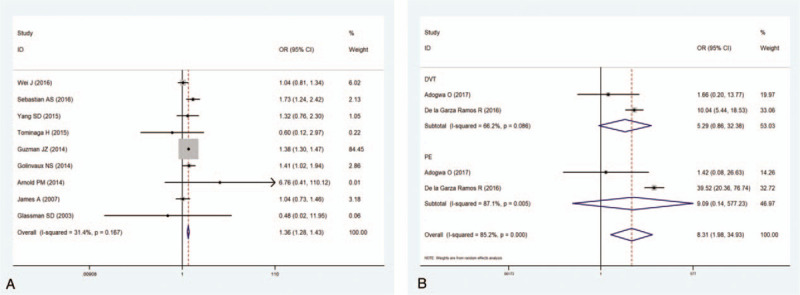
Figure 3.

(A) Forest plot showing the relationship between diabetes and incidence of venous thromboembolism (VTE) after spine surgery. (B) Forest plot showing the relationship between chronic kidney disease and incidence of VTE after spine surgery. CI = confidence interval, OR = odds ratio.
