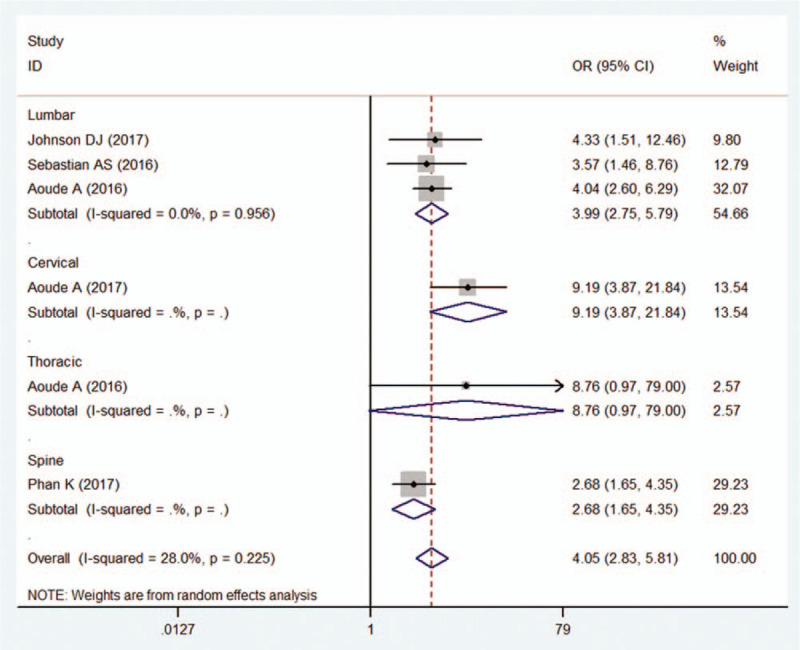
Figure 6.

Forest plot showing relationship between blood transfusion and incidence of venous thromboembolism after spine surgery. Subgroup analysis according to the surgery site was performed. CI = confidence interval, OR = odds ratio.

Forest plot showing relationship between blood transfusion and incidence of venous thromboembolism after spine surgery. Subgroup analysis according to the surgery site was performed. CI = confidence interval, OR = odds ratio.