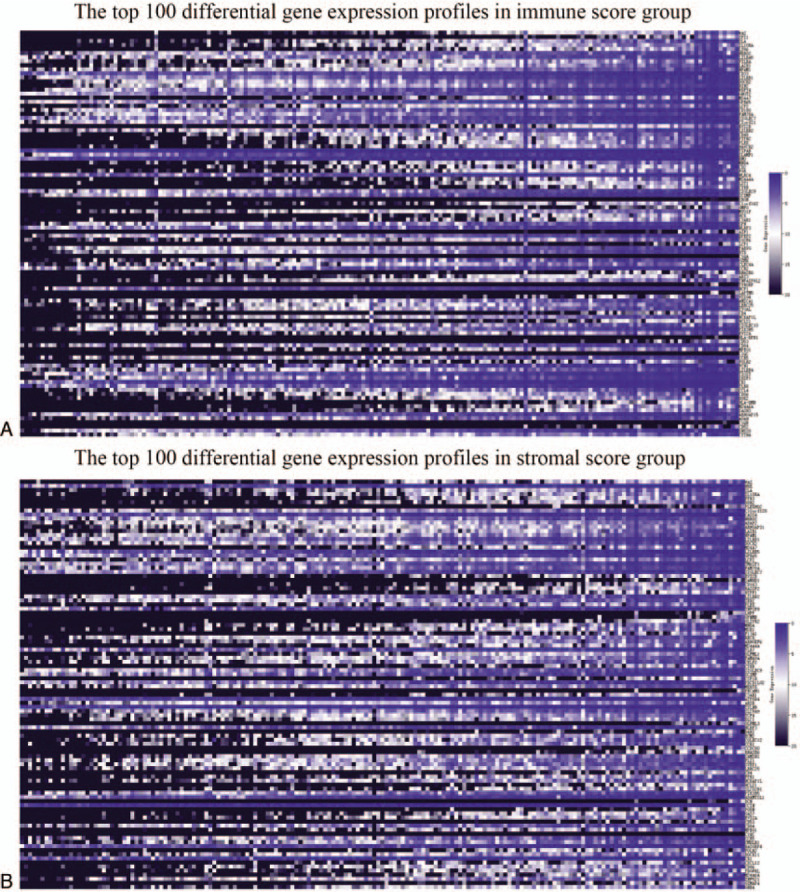
Figure 2.

Comparison of the gene expression profile. A. A Heatmap displaying immune scores of the top 100 DEGs identified in the high score vs. low score groups (P < .05, fold change >2). B. A Heatmap displaying stromal scores of the top 100 DEGs in the high score vs. low score groups (P < .05, fold change >2).
