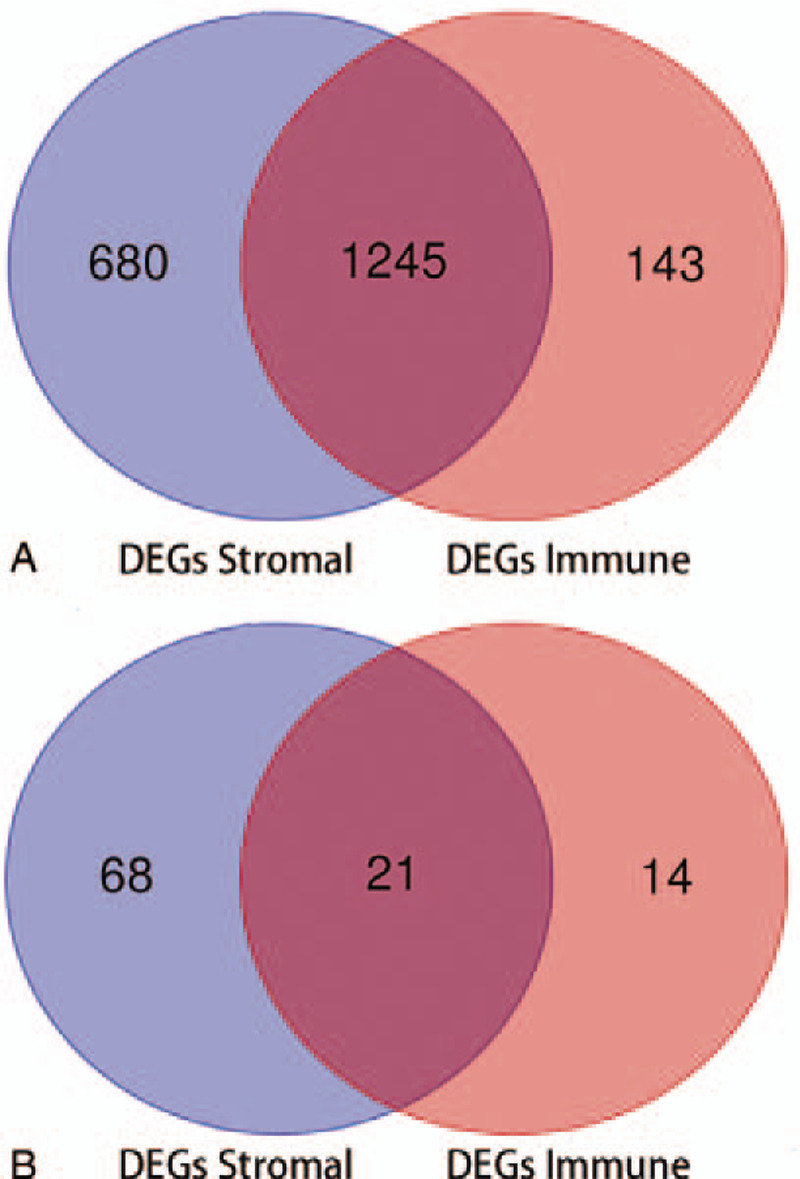
Figure 3.

Overlapping DEGs for the high immune and stromal scores groups. A. Venn diagrams show that 1245 DEGs are up-regulated in the stromal and immune score groups. B. Venn diagrams show the 21 DEGs were down-regulated in the stromal and immune score groups.
