
Figure 1.
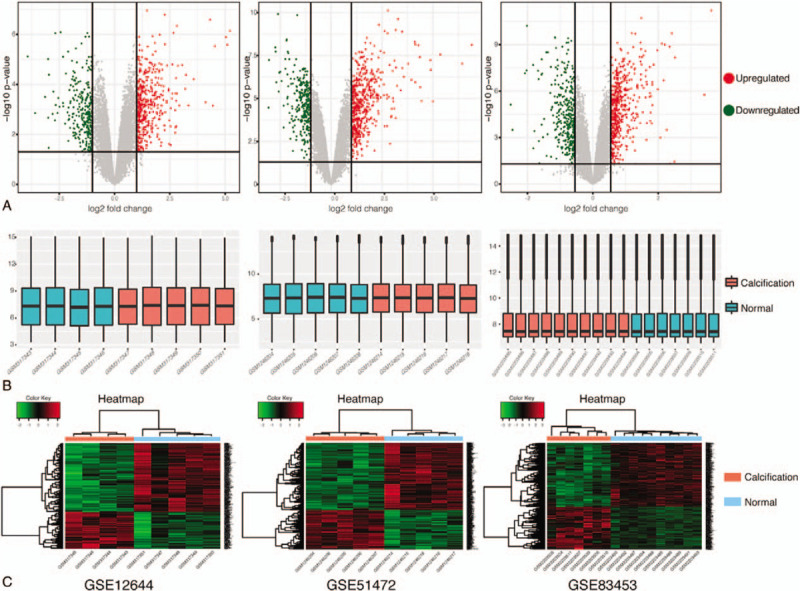
Data standardization and DEG identification in 3 microarray datasets (GSE12644, GSE51472, and GSE83453). A, Respective volcano plots of the 3 datasets. Red plots represent the upregulated genes and green ones represent the downregulated genes with the criteria of P value < .05 and | FC |≥ 2 in GSE12644 and GSE51472 or | FC |≥ 1.5 in GSE83453. B, Poststandardization gene expression levels of each dataset. C, Heatmap of the top 500 significant DEGs. Red and green indicate higher and lower gene expression, respectively. DEG = differentially expressed gene, FC = fold change.