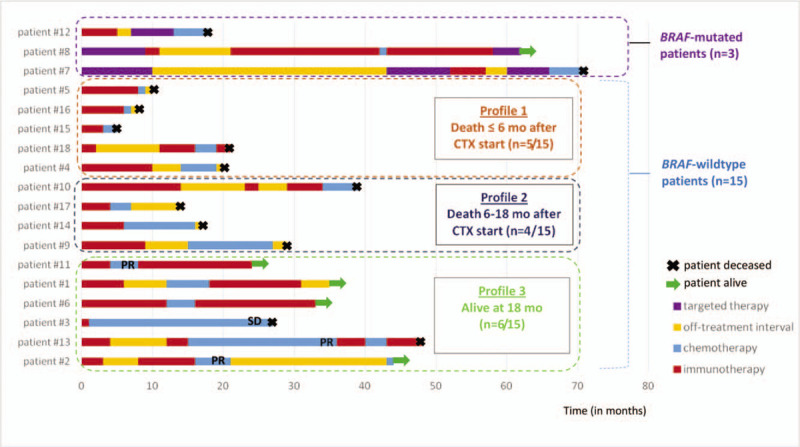
Figure 1.

Patients’ swimmer plot. Each line corresponds to 1 patient. The duration of each treatment is represented with 1 color for each type of treatment. CTX = chemotherapy, Mo = months, PR = partial response, SD = stable disease.

Patients’ swimmer plot. Each line corresponds to 1 patient. The duration of each treatment is represented with 1 color for each type of treatment. CTX = chemotherapy, Mo = months, PR = partial response, SD = stable disease.