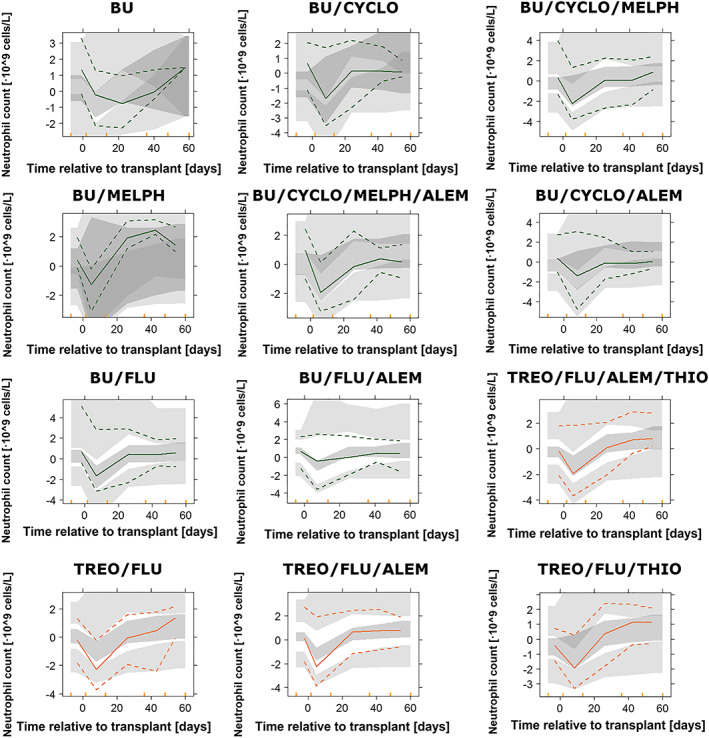
Figure 3.

Results of the prediction‐corrected visual predictive checks from 500 simulated profiles for the pharmacokinetic–pharmacodynamic model, stratified by conditioning group. Coloured points represent raw data, and coloured lines correspond to the 2.5th, 50th and 97.5th percentiles of the raw data. Coloured shaded areas represent the 95% prediction intervals of the 2.5th, 50th and 97.5th percentiles of 500 simulated datasets. Cyclo, Cyclophosphamide; Flu, Fludarabine; Melph, Melphalan; Alem, Alemtuzumab; Thio, Thiotepa; ATG, Anti‐thymocyte globulin
