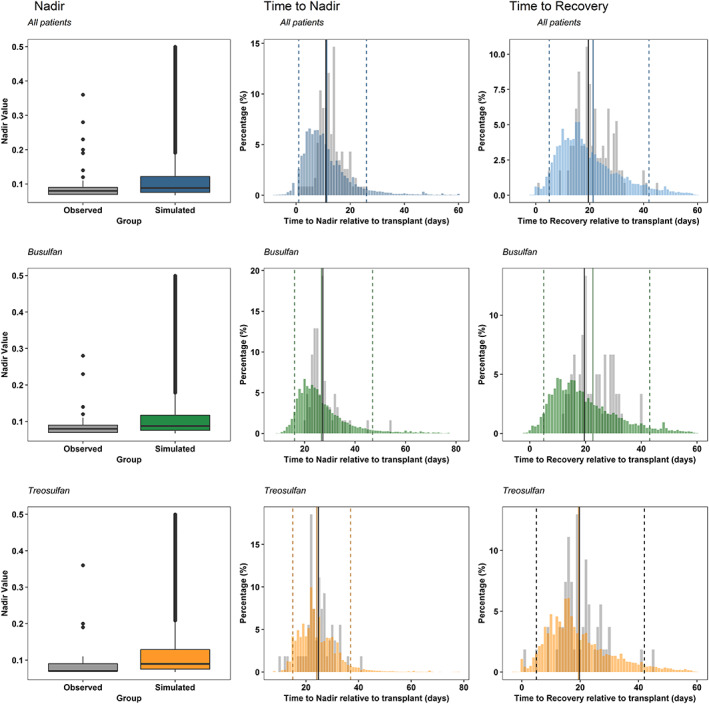
Figure 4.

Results of the numerical predictive checks evaluating nadir grade, time to nadir and time to recovery for all of the patients after 500 simulations of the dataset (blue), and stratified by main conditioning drug; busulfan (green), and treosulfan (orange). Grey bars represent the distribution of the raw data. Black vertical line is the median of the raw distribution. Coloured bars correspond to the simulated data. Coloured solid line is the median of the simulated data, and dashed lines indicate the 95% confidence interval of the simulations
