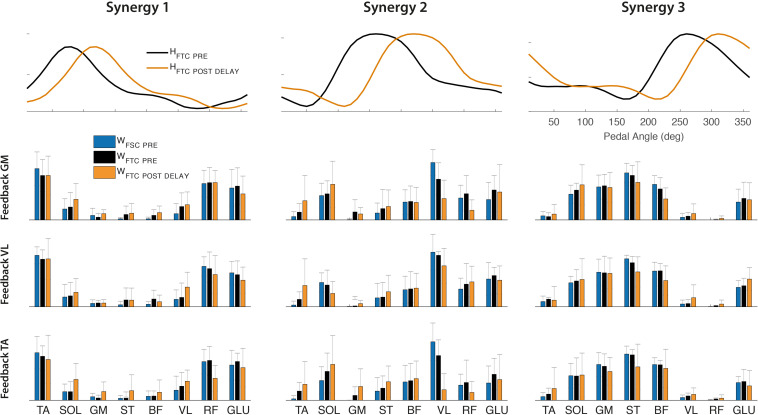
FIGURE 10.
Upper panel: Optimal shift of the activation coefficients obtained by FTCDELAY model (orange line) to reconstruct the POST-1 trial, compared to the original set of activation coefficients extracted by the PRE trial (black line). Lower panel: Synergy vectors obtained from the FTCDELAY model on the POST-1 training set (orange bars), compared to those extracted on the PRE trial from the FTC model (black bars) and FSC model (blue bars).

