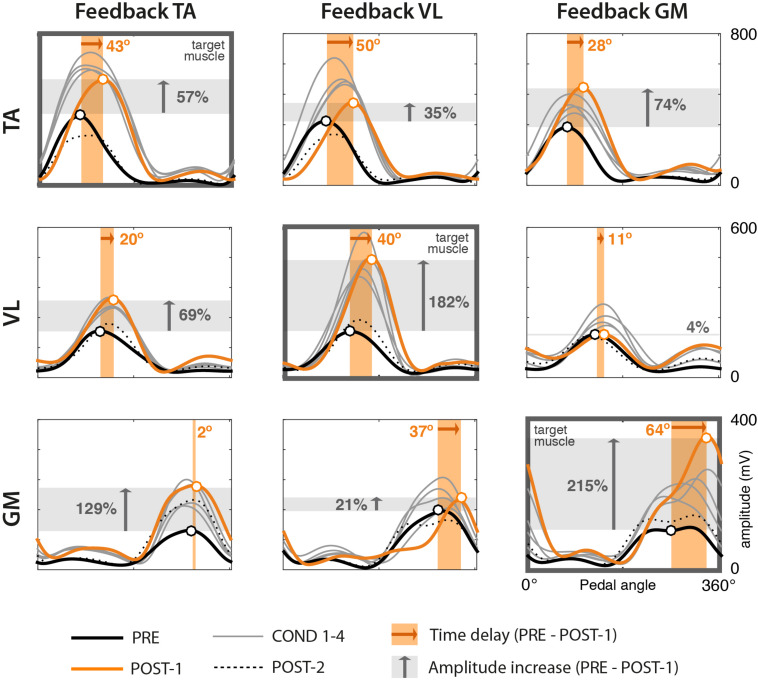
FIGURE 3.
EMG envelopes from one representative subject (Subject 3) across trials. Rows represent the three muscles TA, VL, and GM. Columns represent the three different experimental sessions, each considering a different muscle for visual biofeedback (target muscle). Each curve represents the mean profile of the 60 normalized EMG envelopes of one trial. Trials correspond to the following color code. Bold black: PRE trial. Thin gray: COND 1–4 trials. Orange: POST-1. Dotted black: POST-2. Black and orange circles represent the mean peaks of the envelopes of the PRE and POST-1 trials, respectively. The width of the shaded orange area represents the mean delay between PRE and POST-1 trials (whose values are presented in Table 1). The height of the gray area represents the mean value of the amplitude difference (whose values are presented in Table 2).

