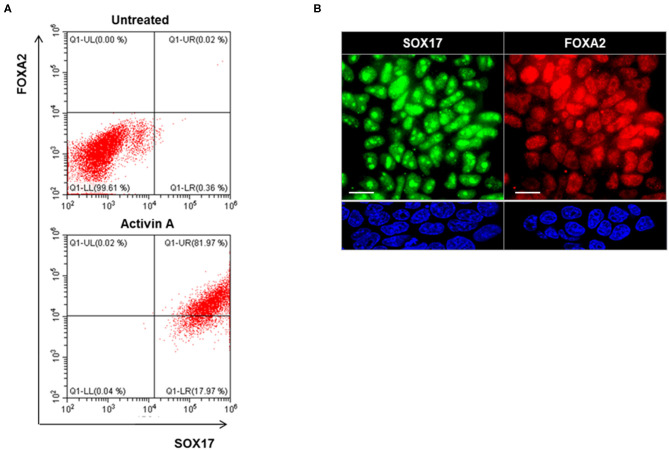
Figure 3.
Endoderm induction in human iPSCs (LF cells). (A) Representative flow cytometry of SOX17 and FOXA2 expressing cells in activin A treated (lower) and untreated (upper) cells. Data were representative of three separate experiments on LF cells treated with activin A for 4 days. (B) Representative images of immunostaining for endoderm markers, SOX17 (Green), and FOXA2 (Red), in in activin A treated LF cells for 4 days (upper panel) and untreated cells (lower panel). Scale bar = 20 μm.

