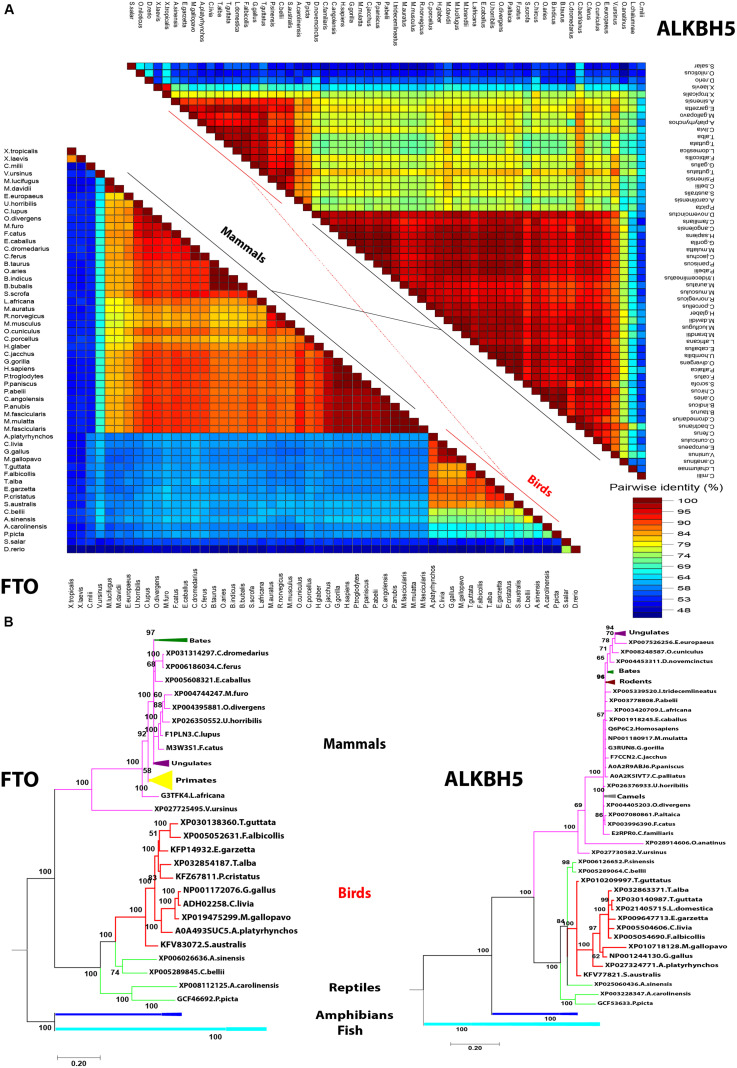
FIGURE 4.
Pairwise distance and phylogenetic analysis of m6A demethylases’ orthologs. (A) Pairwise identity% plot between the erasers performed using an SDT program in different species; the percent identity was represented on the right side scale of the plot. (B) Phylogenetic analysis of m6A erasers in different species. The species were grouped by their orders and indicated by different colors. The phylogenetic trees were generated using MrBayes (http://mrbayes.sourceforge.net/). The name of the species and the accession of each protein are indicated. The avian proteins are marked by red branches. Bootstrap probabilities are denoted at the branch nodes. The scale bar at the bottom indicates the error rate.

