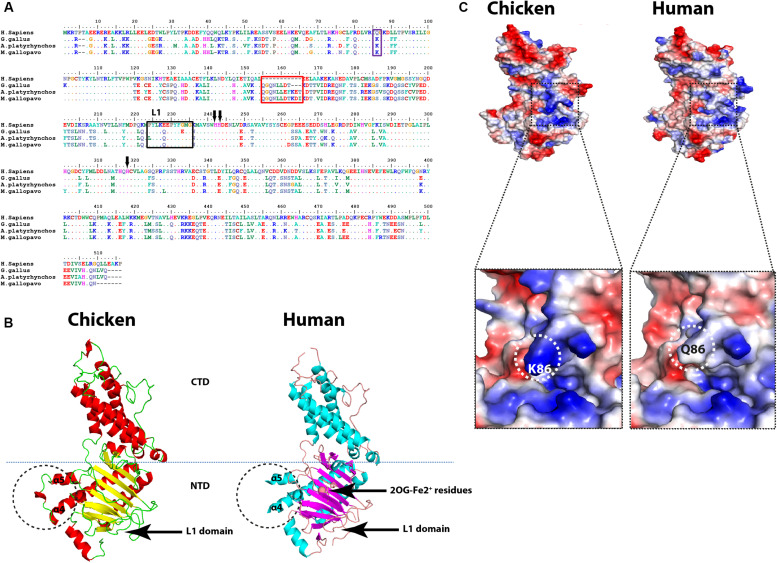
FIGURE 5.
Structural comparison between human and avian fat mass and obesity-associated (FTO) proteins. (A) Sequence alignment of the entire FTOs. The alignment was generated using Clustal W algorithm of MegAlign program (Lasergene, version 3.18). The species of comparison are indicated on the left side. Identical residues are indicated by dots, and sequence variation is denoted by a single-letter code. The insertion is indicated by a red rectangle. The unique FTO Loop 1 (L1) is indicated by a black rectangle. Q86K mutation is labeled by a blue rectangle. The conserved (HxD.H) motif is indicated by black arrows. (B) Overall structure comparison between human FTO (PDB ID: 3LFM) and the predicted chicken FTO. The insertion is indicated by black dashed circles between α4 and α5 helices. CTD, C-terminal domain; NTD, N-terminal domain (active domain); L1, Loop 1 domain; 2OG-Fe2+ residues are indicated. (C) Electrostatic surfaces of the human FTO (PDB ID: 3LFM) and the predicted chicken FTO, enlarged detailed Q86K mutation is highlighted with black dashed borders.

