FIGURE 6.
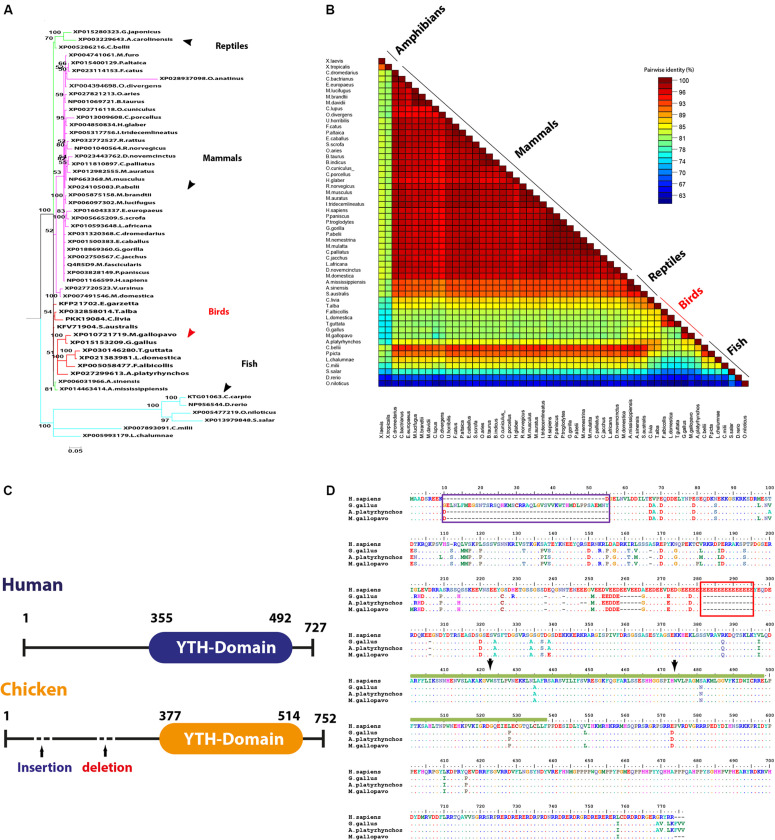
Structural comparison between human and some avian m6A readers. (A) Phylogenetic analysis of YTHDF2 protein between various orthologs. The species were grouped by their orders and indicated by different colors. The phylogenetic trees were generated using MrBayes (http://mrbayes.sourceforge.net/). The name of the species and the accession of each protein are indicated. The avian proteins are marked by red branches. Bootstrap probabilities are denoted at the branch nodes. The scale bar at the bottom indicates the error rate. (B) Pairwise identity% plot between YTHDC2 protein and various orthologs performed using an SDT program; the percent identity was represented on the right side scale of the plot. (C) Domain architectures of the YTHDC1 in Homo sapiens and chicken. (D) Sequence alignment of the entire of YTHDC1 proteins. The alignment was generated using Clustal W algorithm of MegAlign program (LaserGene, version 3.18). The species of comparison was indicated on the left side. Identical residues are indicated by dots, and sequence variation is denoted by a single-letter code. The insertion was indicated by a dark blue rectangle. The deletion was indicated by a dark red rectangle. YTH-domain was highlighted by amino acid under the dark green bar. The conserved aromatic cage residues are indicated by black arrows.

