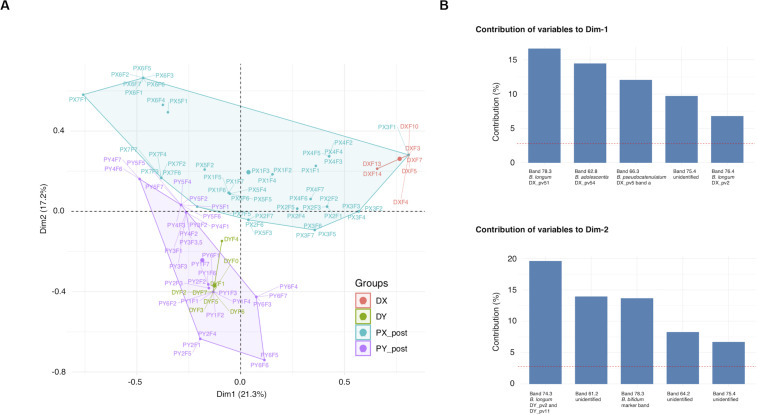
FIGURE 1.
Clustering of Bifidobacterium-specific PCR-DGGE profiles obtained from fecal samples of FMT donors and their recipients at different time points. (A) MCA plot of the recipient post-FMT samples and donor samples. (B) The five band positions contributing the most to each dimension of MCA. DGGE, denaturing gradient gel electrophoresis; MCA, multiple correspondence analysis; DX and DY, FMT donors; PX1-7 and PY1-6, FMT recipients of DX and DY, respectively. Fecal sample time points for recipients and DY: F0, pre-FMT (the time of donation for DY); F1–F7, 3 days, 2 weeks, 1, 2, 4, 8, and 12 months post-FMT, respectively; Time points for DX: F3, the time of donation; F4, F5, F7, F10, F13, and F14, 2 weeks, 1, 2, 4, 8, and 12 months post-FMT, respectively.

