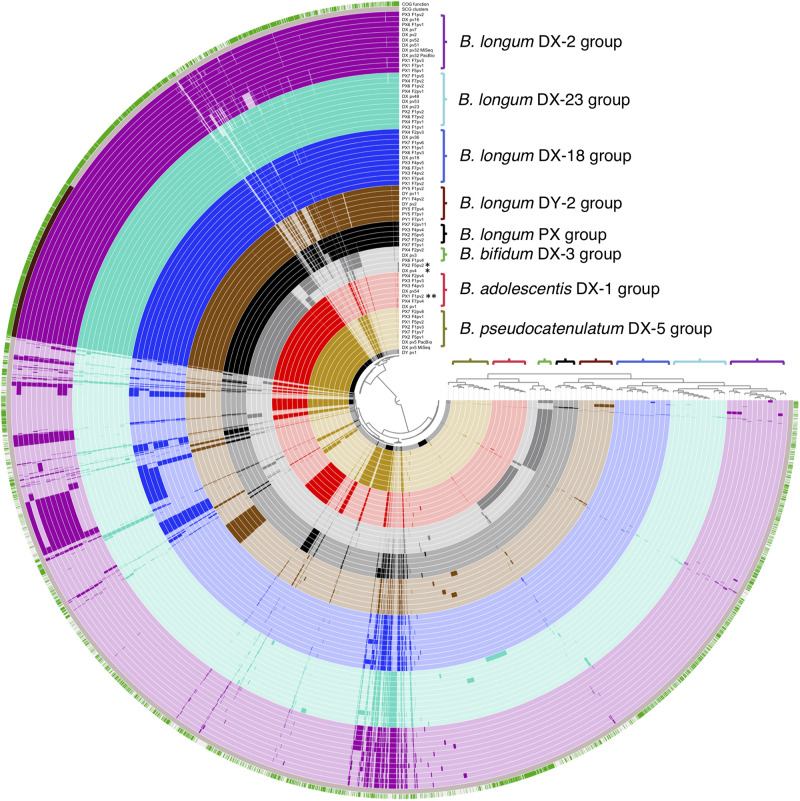
FIGURE 4.
Visual comparison of genomic content of all the 65 sequenced bifidobacterial isolates from FMT donors and their recipients. Colored brackets with group labels refer to the rep-PCR fingerprint groups. The upper layer presents genomic content with known and unknown clusters of orthologous groups (COGs) in green and white, respectively. The second layer presents core genome as single copy gene (SCG) functions in dark brown. DX and DY, FMT donors; PX1-4 and PX6-7, FMT recipients of DX; PY1 and PY5, FMT recipients of DY; F1, F2, F4, F5, and F7, 3 days, 2 weeks, 2, 4, and 12 months post-FMT, respectively; pv1-54, isolate codes; DX_pv5_PacBio and DX_pv32_PacBio, two DX isolate genomes that were sequenced by PacBio in addition to MiSeq; *, B. animalis isolate; **, B. adolescentis isolate not belonging to the DX-1 group.

