
Figure 4.
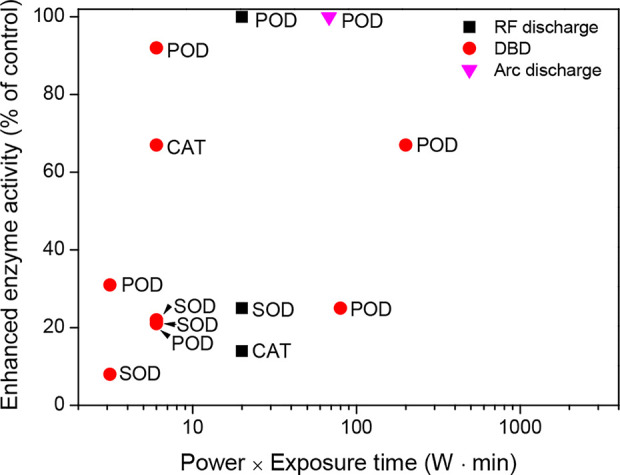
Enhanced enzyme activity (% of control) as a function of the power (W) and exposure time (min) of the plasma treatments in seeds (or seedlings), which were described in the literature presented in Table 3.
Official websites use .gov
A
.gov website belongs to an official
government organization in the United States.
Secure .gov websites use HTTPS
A lock (
) or https:// means you've safely
connected to the .gov website. Share sensitive
information only on official, secure websites.
Enhanced enzyme activity (% of control) as a function of the power (W) and exposure time (min) of the plasma treatments in seeds (or seedlings), which were described in the literature presented in Table 3.