
Figure 6.
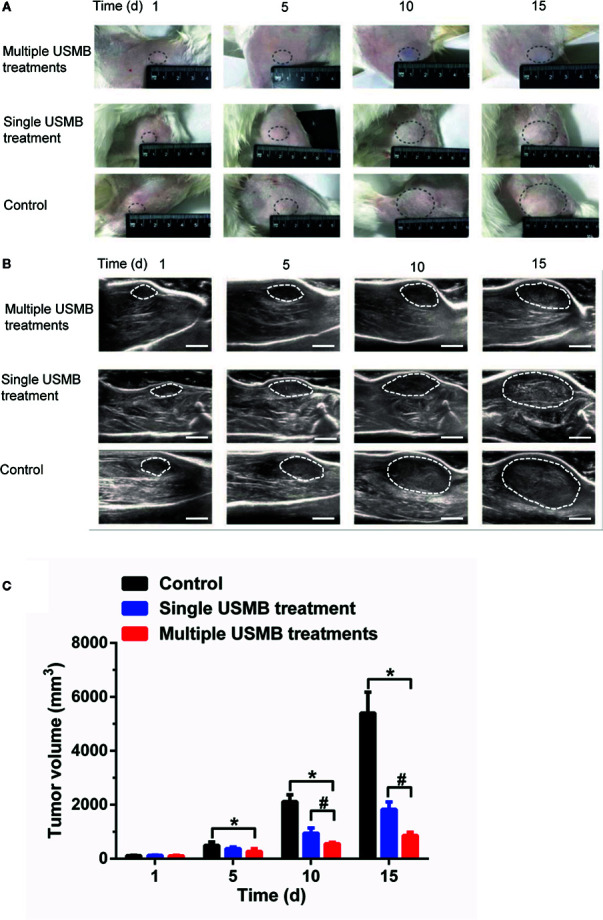
Tumor growth suppression effect of different USMB treatment strategies. Representative images (A) and B-mode ultrasound images (B) of the tumor from one animal in each group. Scale bar = 1 cm. (C) Quantitative analysis of the tumor volume. *p < \0.05, vs. control group; # p < 0.05, vs. all treatment groups.