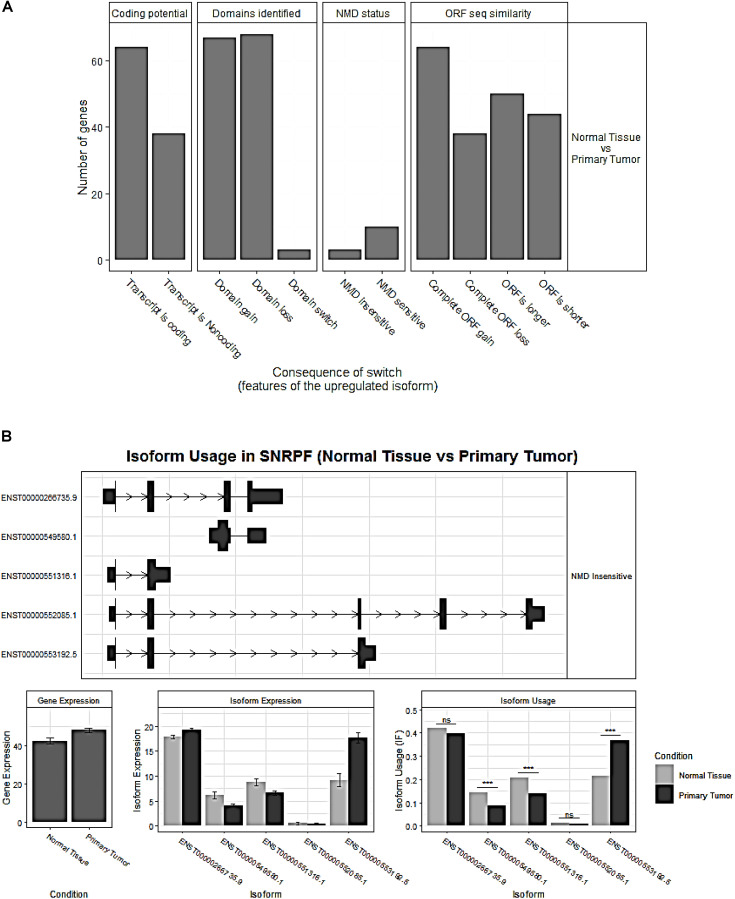
FIGURE 3.
(A) Overview of the number of switched isoforms predicted to have functional consequences. (B) Visualization of switched isoform structure. Taking a splicing factor gene, SNRPF, for example, its isoform ENST00000553192.5.1 showed opposite switching pattern compared to others. In addition, three out of five isoforms showed differential isoform expressions, although no difference for the overall gene expression.

