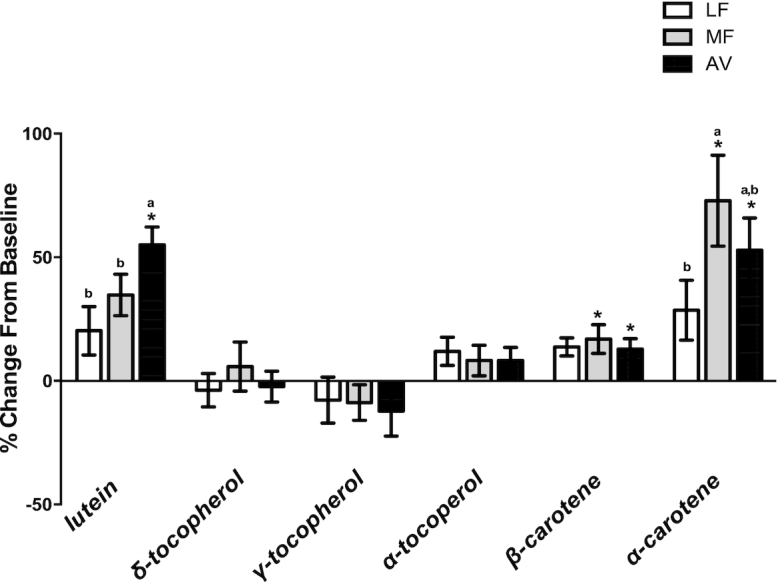
FIGURE 2.

The percentage change of plasma antioxidants after 5 wk of consumption of LF, MF, and AV diets compared with baseline in healthy adults with overweight and obesity (aged 21–70 y). All values are means ± SEMs (n = 42–45). *The concentrations are significantly higher compared with the baseline (P < 0.05). Labeled means without a common letter differ, P < 0.05. Statistical models were run on the raw change values. AV, avocado diet; LF, lower-fat diet; MF, moderate-fat diet.
