
. 2020 Feb 16;52(3):764–778. doi: 10.4143/crt.2020.044
Copyright © 2020 by the Korean Cancer Association
This is an Open Access article distributed under the terms of the Creative Commons Attribution Non-Commercial License (http://creativecommons.org/licenses/by-nc/4.0/) which permits unrestricted non-commercial use, distribution, and reproduction in any medium, provided the original work is properly cited.
Fig. 1.
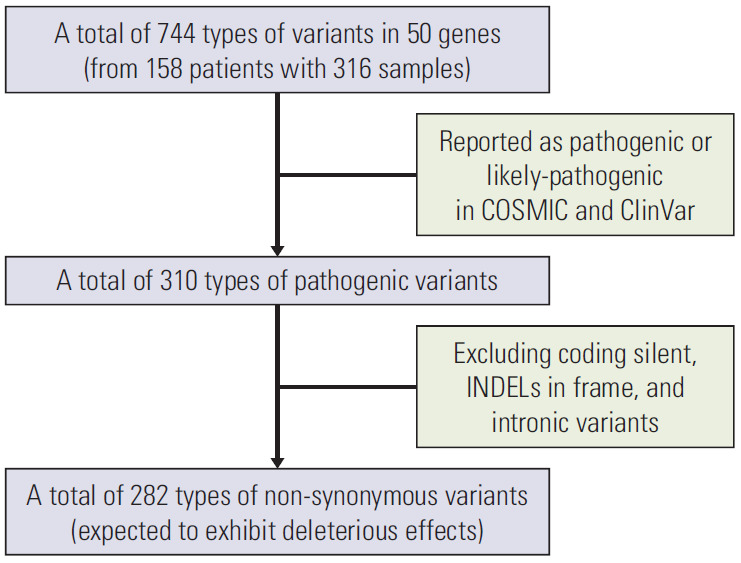
Flow chart for data set.