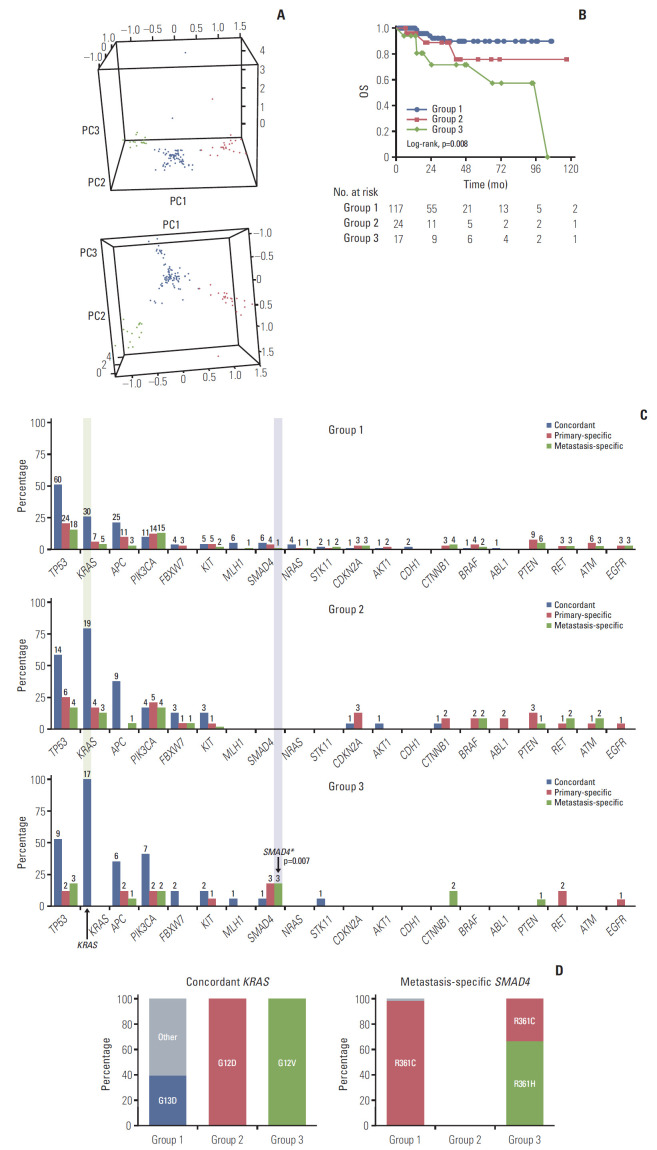
Fig. 3.
Genomic grouping and survival analysis. (A) Three genomic groups were determined using clustering with PC1, PC2, and PC3; group 1 (117, 74.0%, blue), group 2 (24, 15.2%, red), and group 3 (17, 10.8%, green). (B) Overall survival (OS) data. The OS of group 3 was significantly shorter than that of group 1. (C) Genetic frequency between groups and the concordant, primary-specific, and metastasis-specific genes. The frequency of the top 20 concordant (blue), primary-specific (red), and metastasis-specific (green) genes. X denotes each gene, Y denotes percentage of patients with the mutation in each group, and labels denote the number of patients. (D) The proportion of variants of concordant KRAS and metastasis-specific SMAD4 between genomic groups.

