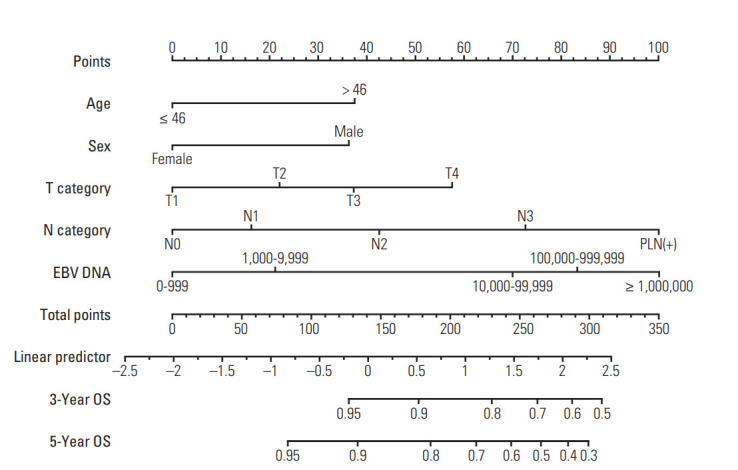
Fig. 3.

Prognostic nomogram for 3- and 5-year overall survival (OS) based on the training cohort. EBV DNA, Epstein-Barr virus DNA. As an example, locate the patient's sex and draw a line straight up to the “Points” axis to determine the associated score. Add the scores achieved for each covariate, and locate this sum on the “Total Points” axis. Draw a line straight down to determine the likelihood of 3- or 5-year OS. As a calculation parameter, “Linear Predictor” is not directly applied to the calculation of the survival rate.
