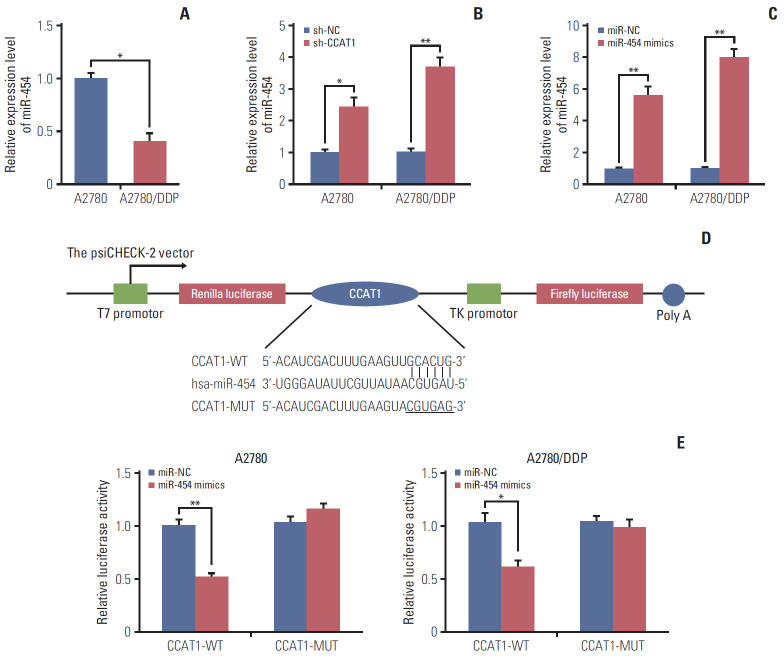
Fig. 3.
Colon cancer-associated transcript 1 (CCAT1) acted as miR-454 sponge to down-regulate its expression. (A) miR-454 levels in A2780 and A2780/DDP cells were determined by quantitative reverse transcription polymerase chain reaction (qRT-PCR). (B) Up-regulation of miR-454 by sh-CCAT1 in A2780 and A2780/DDP cells. miR-454 level was determined by qRT-PCR. (C) miR-454 level was determined by qRT-PCR in A2780 and A2780/DDP cells transfected with miR-NC or miR-454 mimics. (D) An illustration of vector and miR-454 binding sequence in CCAT1. A mutation was generated in the CCAT1 sequence in the complementary site for miR-454 binding. (E) A2780 and A2780/DDP cells were co-transfected with CCAT1-WT/CCAT1-MUT and mimics control/miR-454. Luciferase activity was examined by dual luciferase reporter assay. Renilla luciferase activity was used to normalize the activity of firefly luciferase activity. Data were presented as the mean±standard deviation and performed in triplicate. *p < 0.05, **p < 0.01.

