
Figure 2.
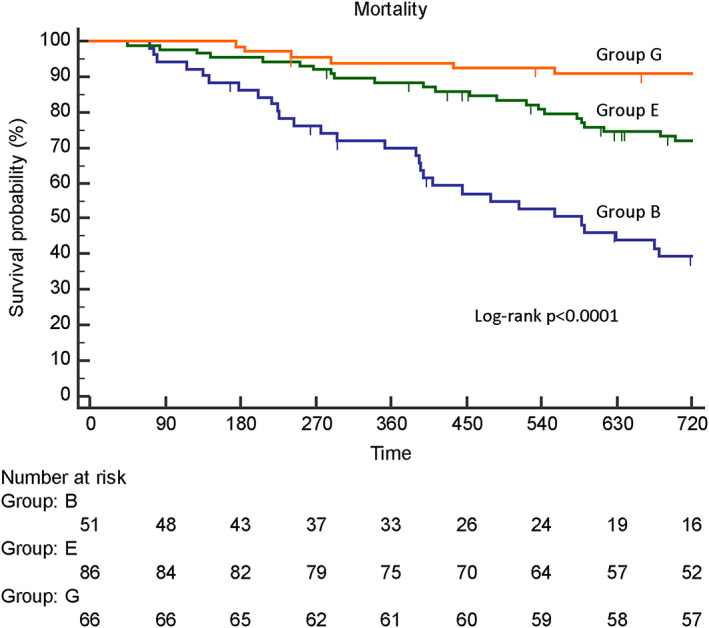
Kaplan–Meier curves for survival probability among the three groups. Group G, both nutritional status and physical capacity at discharge were good; Group E, either variable was good; Group B, both variables were bad.
Official websites use .gov
A
.gov website belongs to an official
government organization in the United States.
Secure .gov websites use HTTPS
A lock (
) or https:// means you've safely
connected to the .gov website. Share sensitive
information only on official, secure websites.
Kaplan–Meier curves for survival probability among the three groups. Group G, both nutritional status and physical capacity at discharge were good; Group E, either variable was good; Group B, both variables were bad.