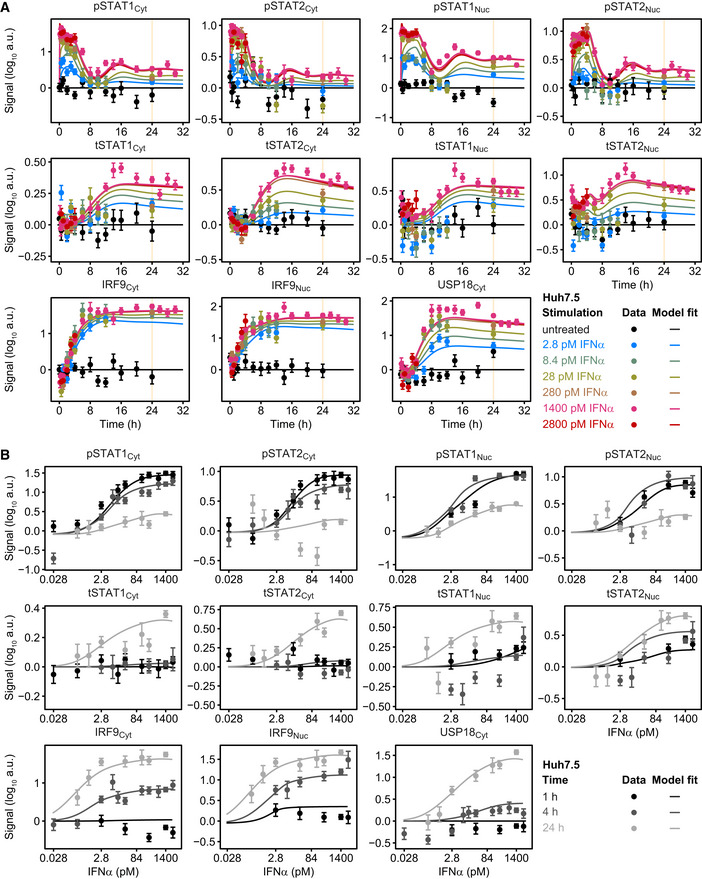
Figure EV1. Time‐ and dose‐resolved quantitative data for model calibration.

-
A, BModel calibration with time‐resolved (A) and IFNα dose‐resolved (B) signal transduction. Huh7.5 cells were growth factor‐depleted and stimulated with different doses of IFNα. Cytoplasmic and nuclear lysates were subjected to quantitative immunoblotting and protein signals detected with chemiluminescence using a CCD camera‐based device. Data were normalized to reference proteins Calnexin or HDAC1 and represented by filled circles with errors representing 1σ confidence intervals estimated from biological replicates using a combined scaling and error model. Model trajectories are represented by solid lines. Yellow line indicates time point 24 h.
