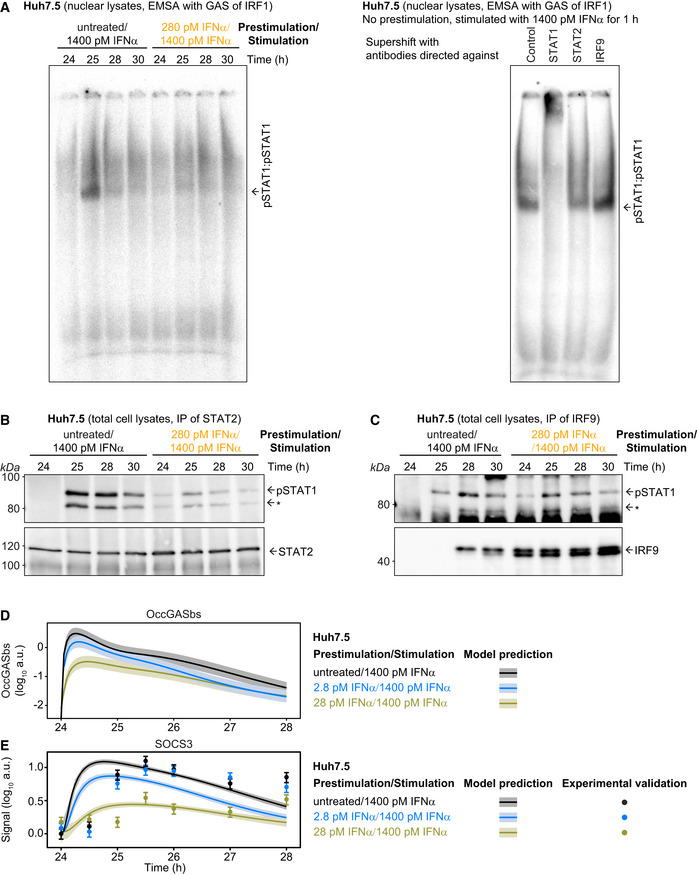
Electrophoretic mobility shift assays were performed using nuclear lysates obtained from untreated Huh7.5 cells or Huh7.5 cells that were prestimulated for 24 h with 280 pM IFNα and then stimulated with 1,400 pM IFNα. Time points after prestimulation with IFNα are indicated. Nuclear lysates were incubated with radioactively labeled oligonucleotides probes harboring the GAS‐binding region of the human IRF1 promoter. A representative image of an EMSA gel of N = 3 replicates is shown (left panel). For the supershift experiments, the mixture of DNA with nuclear lysates from untreated Huh7.5 cells that were stimulated with 1,400 pM IFNα for 1 h was incubated with antibodies against either STAT1, STAT2, or IRF9 (right panel). Samples were resolved on a native polyacrylamide gel, and radioactivity was visualized. Putative pSTAT1:pSTAT1 complexes are indicated.
Co‐immunoprecipitation experiments were performed using total cell lysates obtained from untreated Huh7.5 cells or Huh7.5 cells that were prestimulated for 24 h with 280 pM and then stimulated with 1,400 pM IFNα. Time points after prestimulation are indicated. Lysates were incubated with antibodies directed against STAT2 and subjected to immunoprecipitation. Phosphorylation of STAT1 was detected by quantitative immunoblotting utilizing an antibody that recognizes STAT1 phosphorylated on tyrosine residue 701. An asterisk indicates pSTAT1β. Membranes were re‐probed with antibodies recognizing STAT2. Molecular weights are indicated on the left. Immunoblot detection was performed with chemiluminescence employing a CCD camera‐based device (ImageQuant). A representative immunoblot of N = 3 replicates is shown.
Co‐immunoprecipitation experiments were performed using total cell lysates obtained from untreated Huh7.5 cells or Huh7.5 cells that were prestimulated for 24 h with 280 pM and then stimulated with 1,400 pM IFNα. Time points after prestimulation are indicated. Lysates were incubated with antibodies directed against IRF9 and subjected to immunoprecipitation. Phosphorylation of STAT1 was detected by quantitative immunoblotting utilizing an antibody that recognizes STAT1 phosphorylated on tyrosine residue 701. An asterisk indicates pSTAT1β. Membranes were re‐probed with antibodies recognizing IRF9. Molecular weights are indicated on the left. Immunoblot detection was performed with chemiluminescence employing a CCD camera‐based device (ImageQuant). A representative immunoblot of N = 3 replicates is shown.
Model prediction of IFNα‐induced dynamics of occupied GAS‐bindings sites (OccGASbs) in Huh7.5 cells without prestimulation and in cells prestimulated for 24 h with 2.8 and 28 pM IFNα that were subsequently stimulated with 1,400 pM IFNα. Model predictions were performed using the prediction profile likelihood method. Lines with shading represent model predictions with 1σ confidence intervals.
Model prediction and experimental validation of IFNα‐induced dynamics of SOCS3 protein in Huh7.5 cells without prestimulation and in cells prestimulated for 24 h with 2.8 and 28 pM IFNα that were subsequently stimulated with 1,400 pM IFNα. Model predictions were performed using the prediction profile likelihood method. Lines with shading represent model predictions with 1σ confidence intervals. SOCS3 protein data were used for model validation but not for model calibration. Data are represented by filled circles with errors representing 1σ confidence intervals estimated from biological replicates (N = 3) using a combined scaling and error model.

