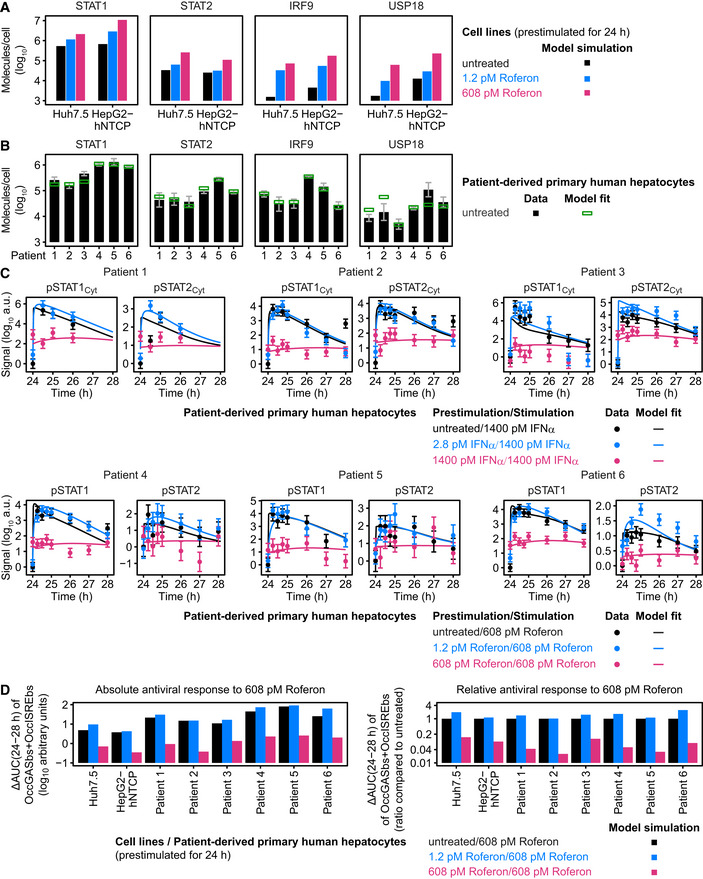
The number of molecules per cell for STAT1, STAT2, IRF9, and USP18 were simulated by the mathematical model for untreated Huh7.5 and HepG2‐hNTCP cells as well as for cells stimulated with 1.2 and 608 pM Roferon for 24 h.
The number of molecules per cell for STAT1, STAT2, IRF9, and USP18 were determined experimentally in primary human hepatocytes from six different patients. Cells were harvested without pretreatment, and different amounts of protein calibrators were spiked in total cell lysates and lysates were subjected to immunoblotting. Detection was performed with antibodies specific to STAT1, STAT2, IRF9, or USP18 using chemiluminescence on a CCD camera‐based device (ImageQuant). Average of at least N = 3 are displayed with standard deviations. Data were used for calibration of a primary human hepatocyte‐specific mathematical model, and estimated values are shown with green squares.
Experimental data and model fits of IFNα‐ and Roferon‐induced phosphorylation of cytoplasmic or cellular STAT1 and STAT2 in growth factor‐depleted primary human hepatocytes prestimulated with 0, 2.8 or 1,400 pM IFNα (patients 1–3) or 0, 1.2 or 608 pM Roferon (patients 4–6). Primary human hepatocytes from the same patients 1–6 as in (B) were used. Experimental data are represented by filled circles (N = 1 per patient). Experimental errors were estimated from the signal variance of the hepatocytes prestimulated with 1,400 pM IFNα. Lines indicate model fits.
Absolute and relative antiviral response is calculated by the mathematical model for each cell line and patient‐derived primary human hepatocytes prestimulated with 0, 1.2, or 608 pM Roferon by simulating the amount of occupied GAS‐ and ISRE‐binding sites upon stimulation with 608 pM Roferon. For the absolute antiviral response, the baseline‐subtracted area under curve (ΔAUC) from 24 to 28 h is shown. For the relative antiviral response, the ΔAUC from 24 to 28 h is divided by the corresponding ΔAUC in cells without pretreatment.

