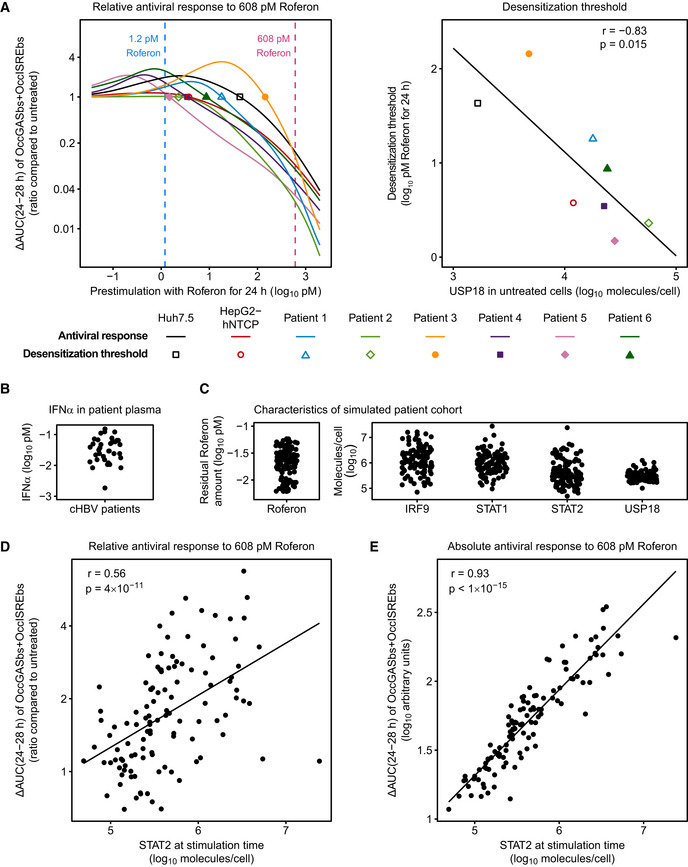
Figure 7. Basal USP18 amounts determine cell type‐specific desensitization threshold, while abundance of STAT2 predicts in vivo responsiveness to Roferon.

- The relative antiviral response upon 608 pM Roferon stimulation (ΔAUC(24–28 h) of OccGASbs + OccISREbs compared to untreated) is shown as a function of the prestimulation dose for the cell lines Huh7.5 and HepG2‐hNTCP as well as for primary human hepatocytes derived from six patients (left). Desensitization thresholds (i.e., the prestimulation dose beyond which the relative antiviral response is smaller than one) are indicated by symbols and plotted against the amount of USP18 in corresponding untreated cells (right). Spearman's rank order correlation coefficient (r) and P‐value (p) are indicated.
- Plasma levels of IFNα were measured in a cohort of 36 patients with chronic HBV.
- For each patient in the virtual patient cohort, a stimulation with 608 pM Roferon was simulated and the relative antiviral response (ΔAUC(24–28 h) of OccGASbs+OccISREbs compared to untreated) was calculated. The relative antiviral response was plotted against the cellular abundance of STAT2. Spearman's rank order correlation coefficient (r) and P‐value (p) are indicated.
- For each patient in the virtual patient cohort, a stimulation with 608 pM Roferon was simulated and the absolute antiviral response (ΔAUC(24–28 h) of OccGASbs + OccISREbs) was calculated. The absolute antiviral response was plotted against the cellular abundance of STAT2. Spearman's rank order correlation coefficient (r) and P‐value (p) are indicated.
