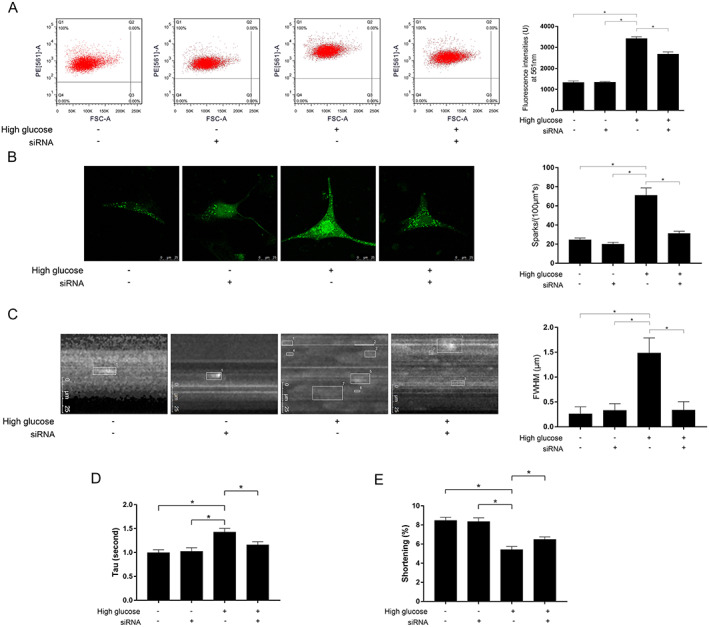
FIGURE 5.

(A) Charts of flow cytometry and fluorescent intensities of calcium indicator Fura‐2/AM indicating the [Ca2+]i in high‐glucose incubated myocytes treated with AAV9‐tdTomato‐SLN siRNA. (B) Captured images of calcium sparks and comparisons of spark incidence in high‐glucose incubated myocytes treated with AAV9‐tdTomato‐SLN siRNA. (C) Captured images of assessing spark amplitude and comparisons of full width at half‐maximum (FWHM) in high‐glucose incubated myocytes treated with AAV9‐tdTomato‐SLN siRNA. (D) Columns indicate calcium removal time constant (Tau) in each group; (E) Columns indicate myocytes shortening in each group, respectively [n = 10; * difference were statistically significant (P < 0.05)].
