Figure 3.

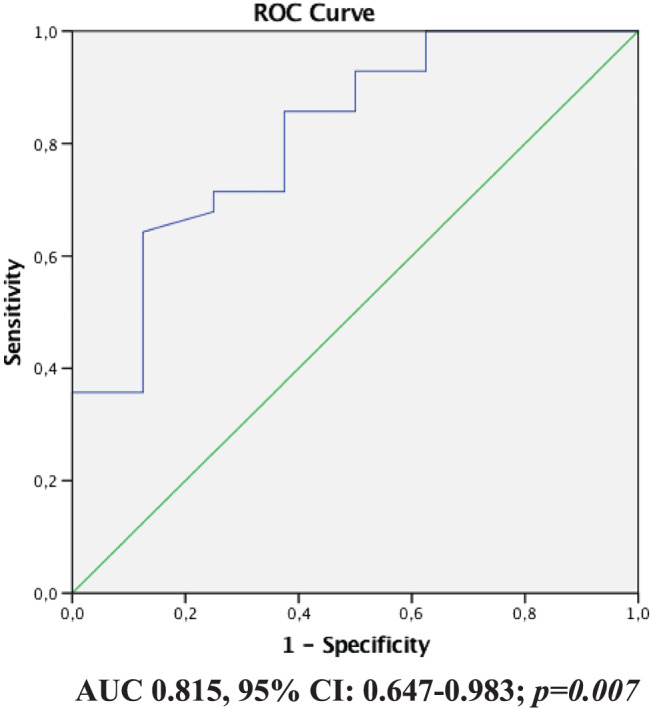
ROC curve of GLS for reduction of the LVEDV. A cut‐off value for GLS of −8.65% (AUC 0.815, 95% CI: 0.647–0.983; P = 0.007) was associated with a 20% reduction of LVEDV, with a sensitivity and specificity of 72% and 70%, respectively.

ROC curve of GLS for reduction of the LVEDV. A cut‐off value for GLS of −8.65% (AUC 0.815, 95% CI: 0.647–0.983; P = 0.007) was associated with a 20% reduction of LVEDV, with a sensitivity and specificity of 72% and 70%, respectively.