Figure 2.

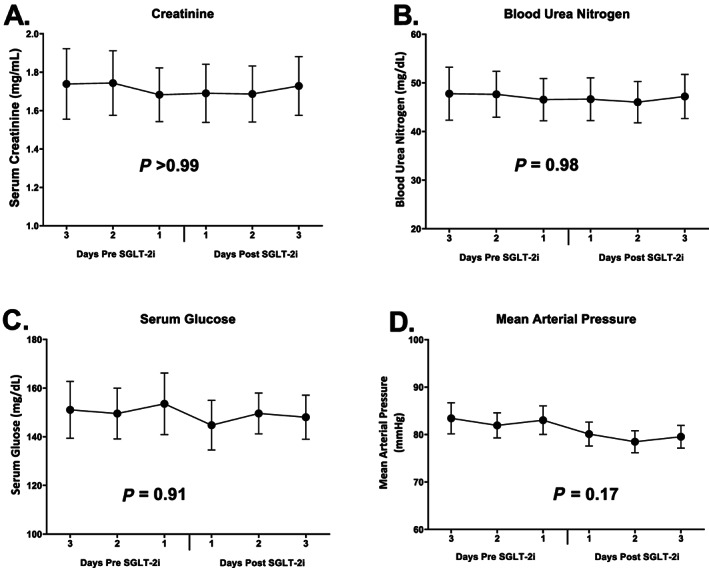
Trends in serum creatinine (A), blood urea nitrogen (B), serum glucose (C), and mean arterial pressure (D) before and after SGLT‐2i therapy. SGLT‐2i, sodium glucose cotransporter 2 inhibitor.

Trends in serum creatinine (A), blood urea nitrogen (B), serum glucose (C), and mean arterial pressure (D) before and after SGLT‐2i therapy. SGLT‐2i, sodium glucose cotransporter 2 inhibitor.