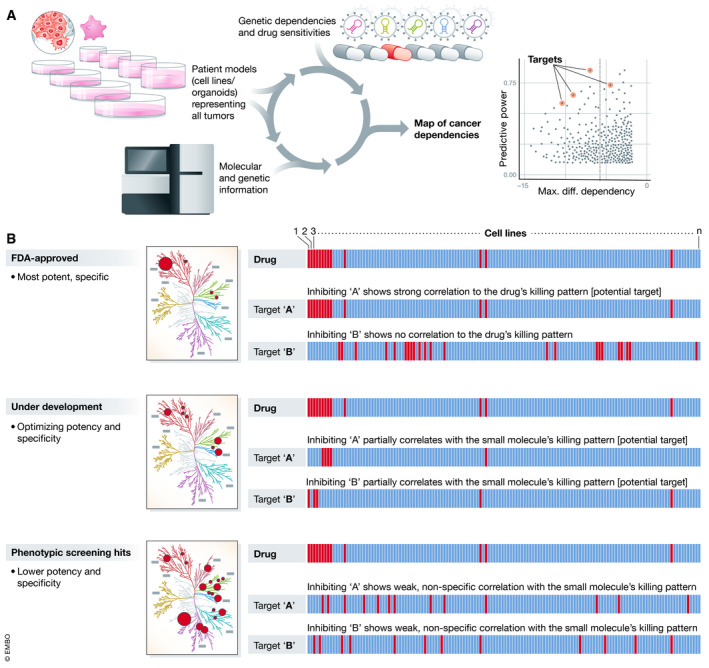
Figure 1. Using the Cancer Dependency Map data to generate MoA hypotheses.

(A) By profiling hundreds of patient models of human cancer, the Cancer Dependency Map systematically identifies gene dependencies, small molecule sensitivities, and the markers that predict their response. (B) Correlations of genetic dependencies and drug sensitivities across cell lines can inform small molecule target(s) identification and mechanism‐of‐action. Red bars: cell killing; blue bars: no cell killing.
