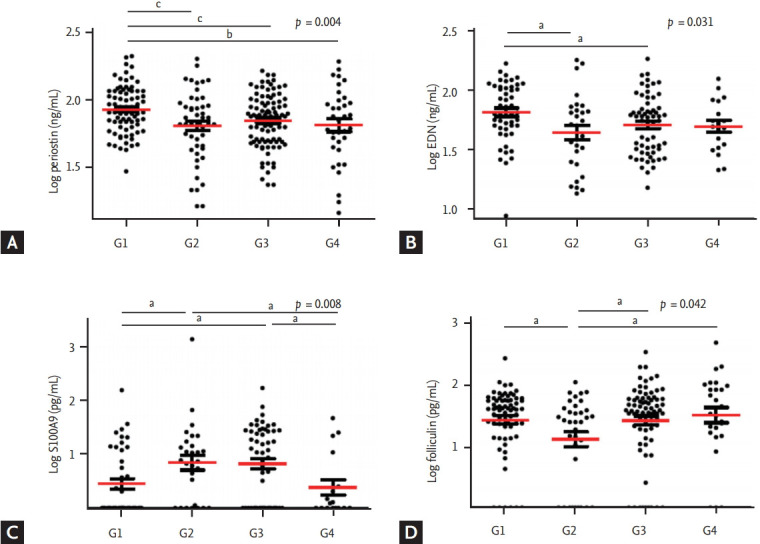
Figure 1.

Serum cytokine levels of (A) periostin, (B) EDN, (C) S100A9, and (D) folliculin according to sputum inflammatory cell profile. Individual data were compared by analysis of variance, and group data were compared by Student’s t test. G1, eosinophilic (n = 149); G2, mixed (n = 71); G3 neutrophilic (n = 155); G4, paucigranulocytic group (n = 46). EDN, eosinophil-derived neurotoxin. a p <0.05, b p <0.01, c p<0.005, by Student’s t test.
