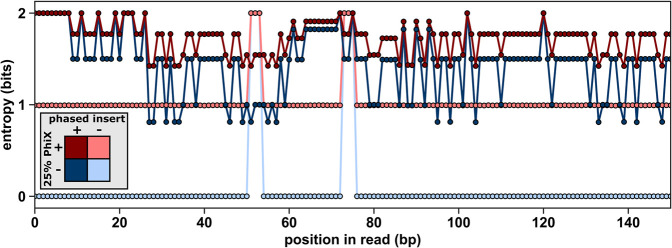
FIGURE 2.
Calculation of positional entropy from simulated sequencing data. Entropy was calculated for four simulated twister ribozyme library samples based on the balance of nucleotides that would be observed at each sequencing cycle. At each position in the read (y-axis), the maximum entropy = 2 occurs when there is an equal probability of all four nucleotides. The minimum entropy = 0 when the same nucleotide occurs at the same position in all sequences. Positional entropy is shown for simulated sequencing runs representing the four conditions that were experimentally sequenced. The control library without phased nucleotide inserts or PhiX (light blue), only 25% PhiX (light red), addition of only phased inserts (dark blue), or both phased inserts and PhiX (dark red).

