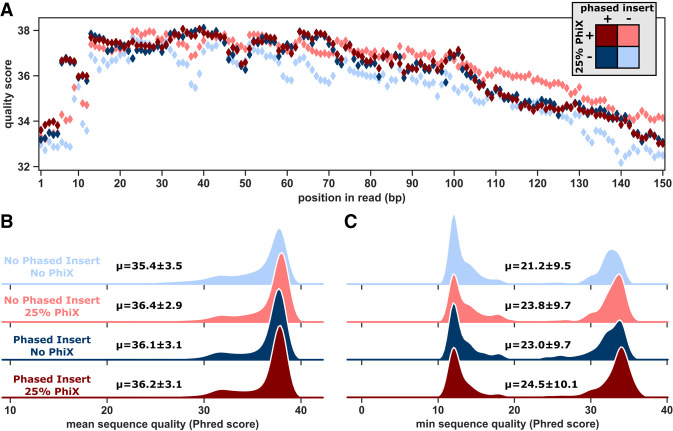
FIGURE 3.
Quality scores of sequencing runs. (A) Mean sequencing quality scores per position in the read for samples without phased nucleotide inserts or PhiX (light blue), only 25% PhiX (light red), addition of only phased nucleotide insertions (dark blue), or both phased insertions and PhiX (dark red). (B) Distribution of mean sequence quality (Phred score) for sequencing runs. (C) Distribution of minimum sequence quality (Phred score) for sequencing runs.

