FIGURE 3.
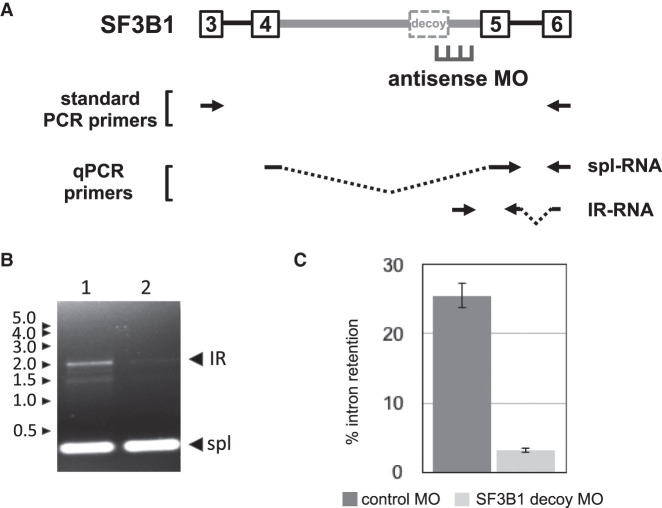
Antisense inhibition of SF3B1 IR. (A) SF3B1 gene structure in the IR region showing retained intron 4 (thick gray line) and its major decoy exon, together with adjacent introns and exons. Position of antisense MO designed to block the 5′ splice site is shown, along with primer pairs used for RT-PCR. (B) Gel analysis of IR and spliced bands amplified from endogenous SF3B1 transcripts by standard RT-PCR from cells treated with negative control MO (lane 1) or SF3B1 decoy-specific MO (lane 2). (C) SF3B1 IR, as a percentage of total SF3B1 transcripts, in cells treated with negative control or decoy-specific MO. IR was assessed using RT-qPCR to compare the relative amounts of IR and spliced products. Results show average IR of three experiments. Error bars indicate standard deviation.

