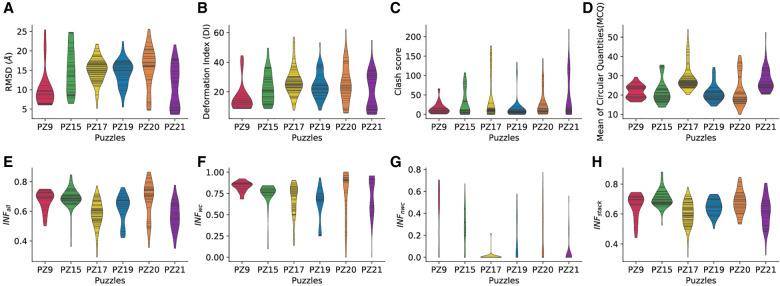
FIGURE 1.
The distributions of structure comparison metrics of the six puzzles. The distribution of structure assessment metrics is plotted as the violin plots where each prediction model is shown as a solid line in the violin plot. Thus, the vertical spread displays the range of values for a given metric in all predicted models and the horizontal breadth reflects the number of predicted models at a given value. The assessment metrics include (A) RMSD, (B) Deformation Index (Parisien et al. 2009), (C) Clash score, (D) the Mean of Circular Quantities (Zok et al. 2014) and (E–H)Interaction network fidelity (Parisien et al. 2009) for all parameters together, Watson–Crick pairs, non-Watson–Crick pairs and stacking.

