FIGURE 2.
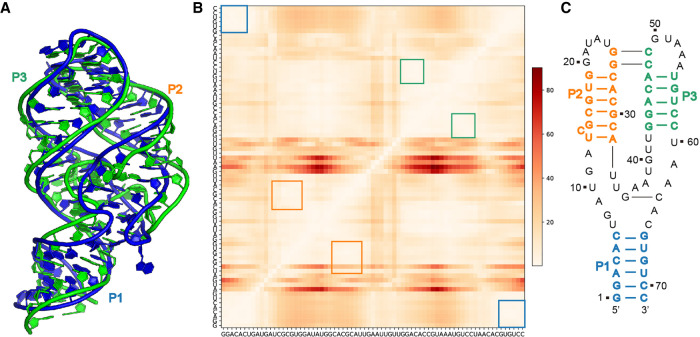
Puzzle 9: 5-hydroxytryptophan riboswitch aptamer. (A) 3D structure comparison between the predicted model with the lowest RMSD (Chen group model 7, shown in blue) and the reference structure in green. (B) The heatmap shows the deformation profile, poorly predicted regions are shown in red; the red regions concentrate on the loop escaping P2 and P3 with the linking region between P2 and P3. (C) The numbering and secondary structure of the reference structure.

