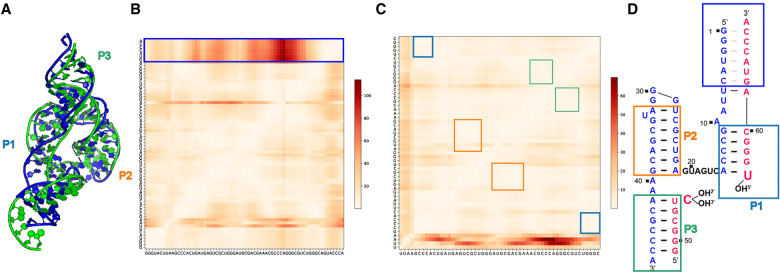
FIGURE 3.
Puzzle15: Hammerhead ribozyme. (A) 3D structure comparison between the predicted model with the lowest RMSD (Adamiak model 8, shown in blue) and the reference structure in green. (B) The heatmap shows the deformation profile, in which the poorly predicted regions are shown in red. The largest deviations happen between the 5′- and the 3′-ends. The large deviations, between the 5′- and 3′-ends in the blue box, are artifactual as discussed in the text (see also (D)). (C) When the 5′- and the 3′-ends are removed from evaluation, RNAComposer model automated server model 1 in the round 1 prediction ranks the best. The heatmap shows the deformation profile, in which the poorly predicted regions are shown in red. calculations of the heatmap. (D) The secondary structure of the reference structure. Nucleotides 1–6 and 63–68 (the gray dashes) within the blue rectangle do not form intramolecular base-pairing but instead, they form base pairs with symmetry-related molecules in the crystal (see text for discussion).

