FIGURE 7.
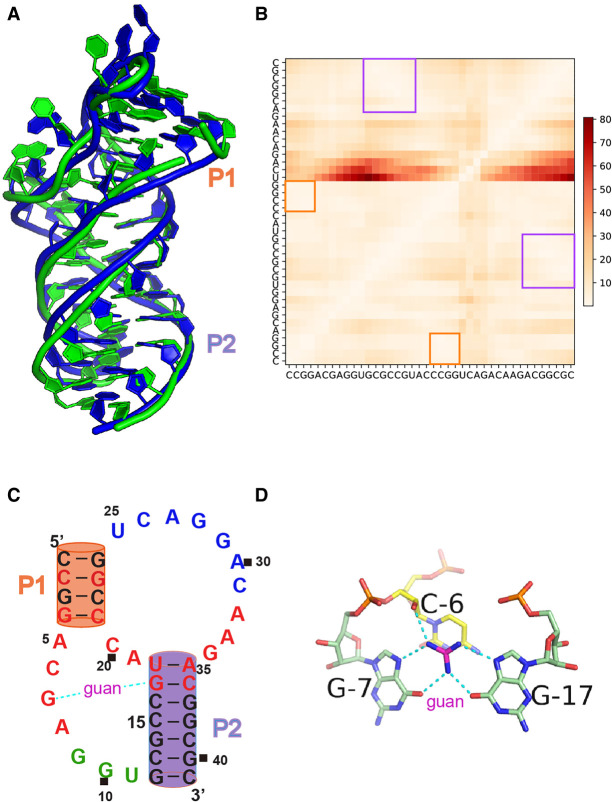
Puzzle 21: Guanidine III Riboswitch. (A) 3D structure comparison between the predicted model with the lowest RMSD (LORES approach from Das group model 1, shown in blue) and the reference structure in green. (B) The heatmap shows the deformation profile, in which the poorly predicted regions are shown in red. The largest deviations occur at the single strand leaving P1 to join P2 (UCAG). (C) The secondary structure of the reference structure. (D) The guanidine binding site in the crystal structure, where guanidine is shown as magenta and proximal contacts are shown as cyan dashed lines.

