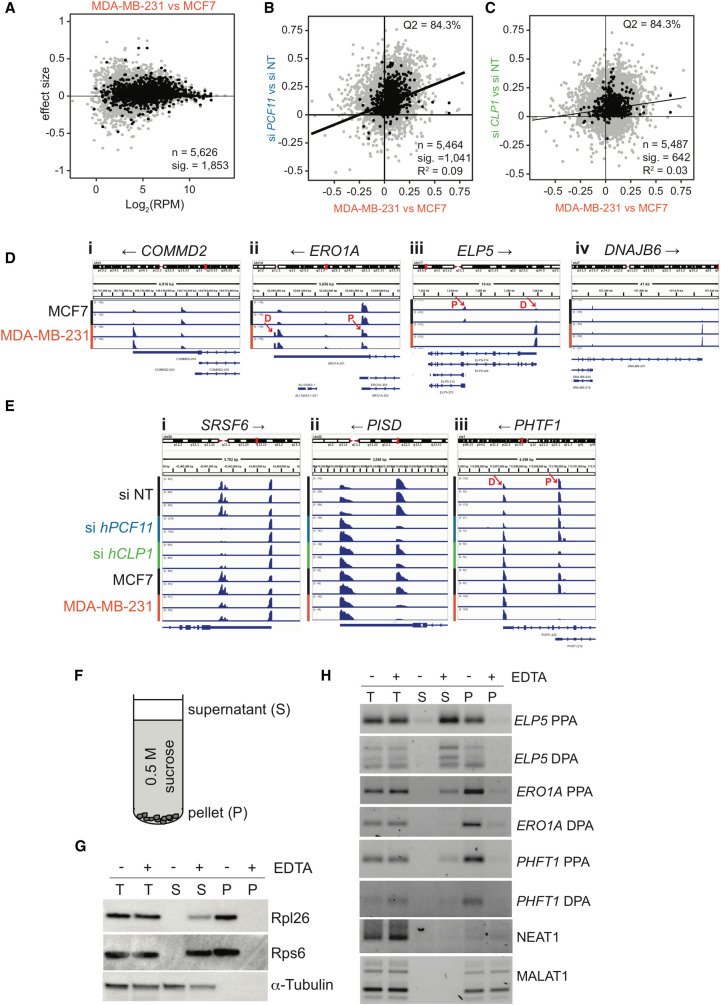
FIGURE 3.
APA shifts in breast cancer cells. (A) 3′ end shift effects in annotated features (n = 5626) observed in MDA-MB-231 cells relative to MCF7 cells. The interpretation is as described in the legend to Figure 2B. 1853 of these effects were significant (FDR < 0.05). Log2 (RPM) indicates the number of reads per million. n = 2. (B) Comparison of 3′ end shift effects observed upon knockdown of hPCF11 (n = 2) relative to nontargeting siRNA samples (n = 3) (y-axis) and MDA-MB-231 cells (n = 2) relative to MCF7 cells (n = 2) (x-axis). Gray dots indicate shift effects for all analyzed features (n = 5464); black dots indicate shift effects that are significant (n = 1041; FDR < 0.05). The majority of genes experienced a shift into the same direction (long versus short) as indicated by 84.3% of all features located to the top right quadrant. (C) Comparison of 3′ end shift effects observed upon knockdown of hCLP1 (n = 2) relative to nontargeting siRNA samples (n = 3) (y-axis) and MDA-MB-231 cells (n = 2) relative to MCF7 cells (n = 2) (x-axis). Gray dots indicate shift effects for all analyzed features (n = 5487); black dots indicate shift effects that are significant (n = 642; FDR < 0.05). The majority of genes experienced a shift into the same direction (long versus short) as indicated by 84.3% of all features located in the top right quadrant. (D) IGV representation of PAT-seq data for MCF7 and MDA-MB-231 cells for (i) COMMD2 (COMM domain-containing protein 2), (ii) ERO1A (endoplasmic reticulum oxidoreductase 1 alpha), (iii) ELP5 (elongator acetyltransferase complex subunit 5), and (iv) DNAJB6 (DnaJ heat shock protein family [Hsp40] member B6). Shown are only relevant 3′-UTR regions and poly(A) site usage in MCF7 and MDA-MB-231 cells, respectively. Overlapping noncoding transcripts are shown at the bottom of the IGV window. Black arrows indicate direction of gene transcription. n = 2. Red arrows indicate the approximate position of primers designed to amplify ∼100 bases of unique sequence within the peak region of PAT-seq reads as used for Figure 3H. D and P indicate the location of a distal and proximal poly(A) sites, respectively. (E) IGV representation of PAT-seq data for (i) SRSF6 (serine and arginine rich splicing factor 6), (ii) PISD (phosphatidylserine decarboxylase), and (iii) PHTF1 (putative homeodomain transcription factor 1). Shown are relevant 3′-UTR regions and poly(A) site usage in nontargeting siRNA control (n = 3) and hPCF11 (n = 2) and hCLP1 (n = 2) knockdown samples as well as MCF7 (n = 2) and MDA-MB-231 (n = 2) cells, respectively. Overlapping noncoding transcripts are shown at the bottom of the IGV window. Black arrows indicate direction of gene transcription. Red arrows indicate the approximate position of primers designed to amplify ∼100 bases of unique sequence within the peak region of PAT-seq reads as used for Figure 3H. D and P indicate the location of a distal and proximal poly(A) sites, respectively. The representation uses different y-axes for each horizontal panel to highlight the relative ratio of poly(A) site usage within a gene in a replicate sample. An alternative representation of the data with normalization to the highest peak in all shown panels is shown in Supplemental Figure S2C. (F) Schematic representation of sucrose cushion analysis. Centrifugation yielded a supernatant fraction (S) and a pellet fraction (P), which was analyzed for protein and RNA content. (G) Western analysis of protein obtained from sucrose cushion centrifugation of MCF7 lysates in the absence and presence of EDTA. Supernatant (S) and pellet fractions (P) were analyzed for Rpl26 and Rps6, which are components of the large and small ribosomal subunits, respectively. α-tubulin was used as cytosolic control. (H) RT-qPCR analysis of RNA obtained from sucrose cushion centrifugation of MCF7 lysates in the absence and presence of EDTA. Supernatant (S) and pellet fractions (P) were analyzed for the presence of the indicated RNA species. PPA indicates RNA resulting from usage of a major proximal, UTR or intronic poly(A) site, and DPA indicates RNA resulting from usage of a distal poly(A) site located in the 3′-UTR, respectively. Approximate location of primers used to amplify ∼100 bases of unique sequence is indicated in D and E. NEAT1 and MALAT1 are nontranslated lncRNA controls.

