
Fig. 1.
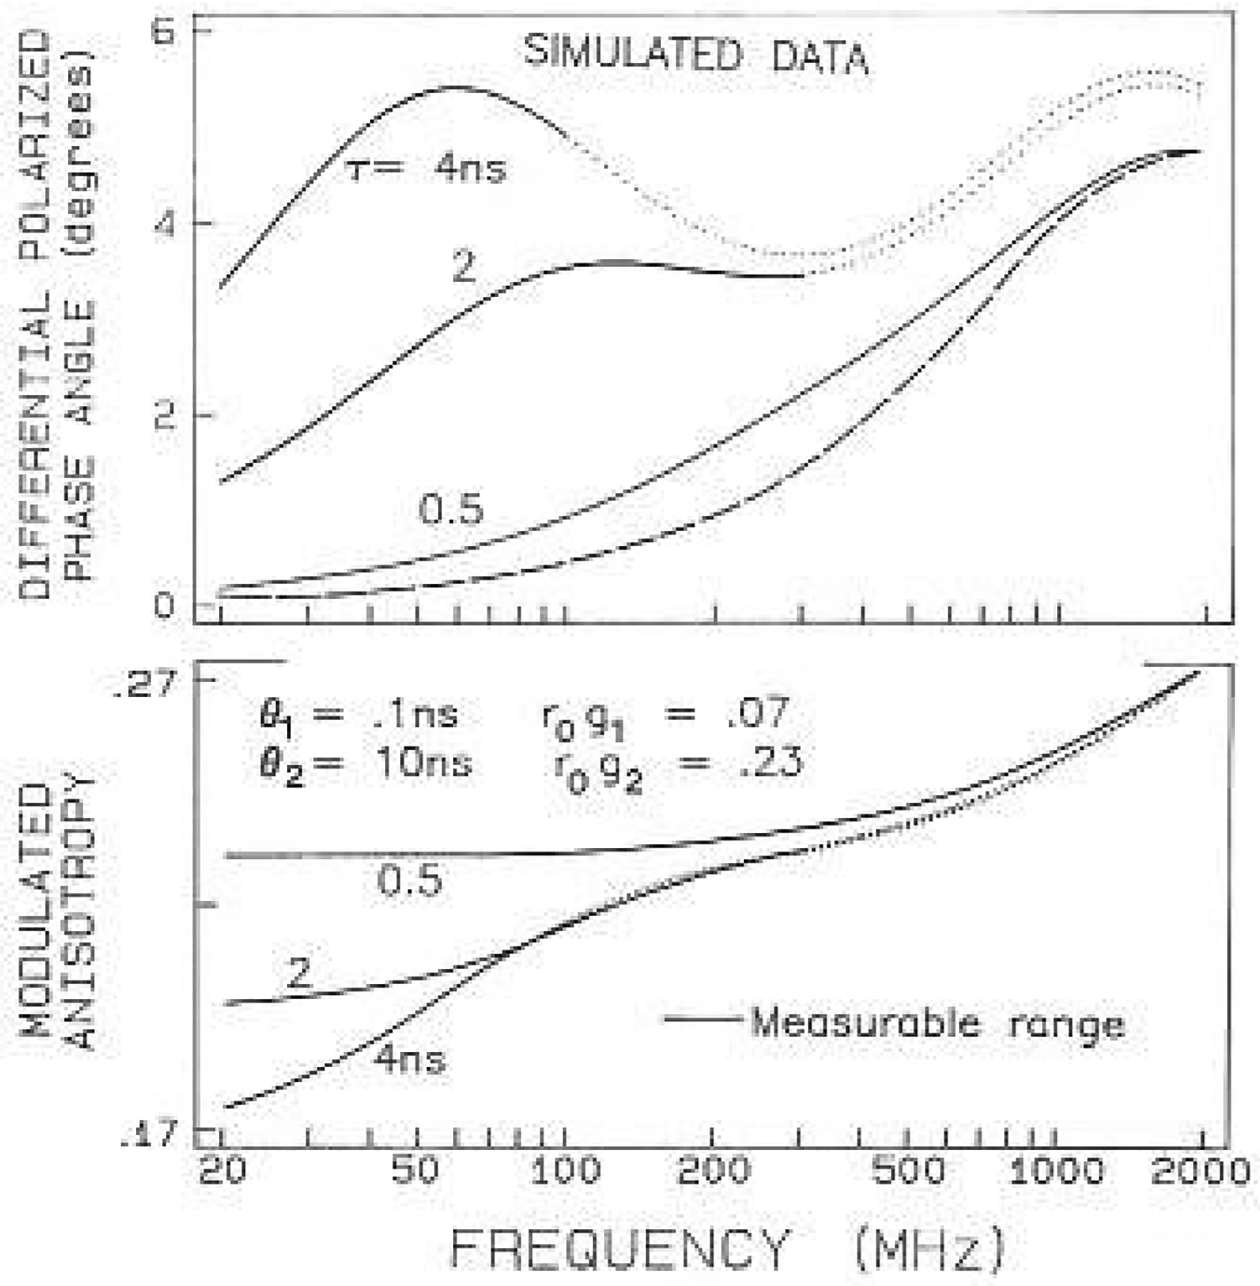
Simulated frequency-domain anisotropy data. The simulated correlation times were assumed to be 0.10 and 10.0 ns. with amplitudes of 0.07 and 0.23, respectively. Simulated data are shown for decay times of 4. 2 and 0.5 ns. The solid regions of the curves indicate the measurable frequency range, where the modulation is 0.2 or larger Tor the intensity decay. The dashed line shows the phase values expected for the 0.1 ns correlation time, with the smaller amplitude (0.07)